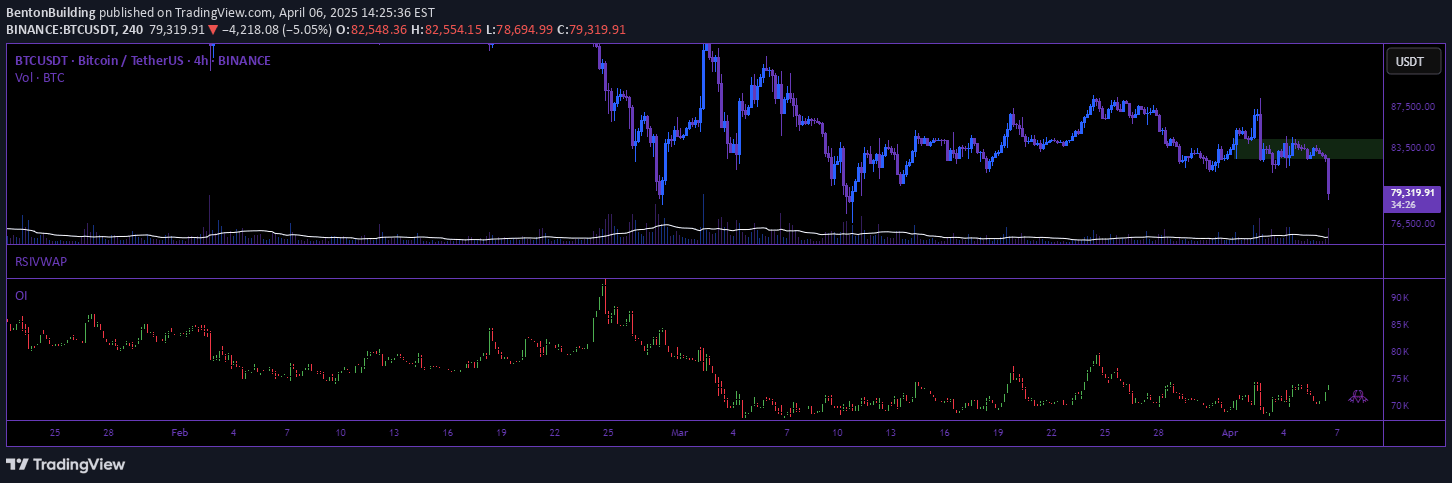
A trading indicator that identifies key liquidity levels by visualizing potential price reversal points where stop-loss orders accumulate, helping traders understand potential market movements.
Explore complementary indicator rolesHow it works
The Liquidation Levels indicator analyzes price charts to identify significant highs and lows where traders commonly place stop-loss orders. By examining trading volume and visible price extremes, it estimates areas of concentrated liquidity, marking these zones with color-coded lines on the chart.
As price moves through these liquidity pools, the indicator helps traders visualize potential reversal points and market dynamics. The more saturated and vivid the lines, the more significant the potential liquidity accumulation, signaling areas where price might experience substantial movement or direction change.
Why it may be useful
Understanding liquidity pools is crucial for traders seeking to anticipate market movements and potential trend reversals. By revealing where large clusters of stop-loss orders are likely positioned, traders can gain insights into potential price action and make more informed trading decisions.
The indicator provides a visual representation of market psychology, highlighting areas where significant trading activity might occur. This information helps traders identify potential entry and exit points, manage risk more effectively, and develop more strategic trading approaches based on the underlying market structure.
When to explore it
The Liquidation Levels indicator is most effective in markets with clear price structures and consistent trading volumes. It works best in liquid markets like forex, futures, and major stock indices where trader behavior creates predictable liquidity patterns.
Traders should use this indicator in conjunction with other technical analysis tools to confirm signals and validate potential trade setups. It is particularly useful during market transitions, breakouts, and periods of consolidation where understanding liquidity dynamics can provide a competitive edge in trading decision-making.
Keep exploring
What we’ve verified
Access, alerts and repainting behaviour have not been independently verified for this indicator. Check the creator’s current publication and settings.
General descriptions and classifications are recovered research. Verified details above identify the specific checks we have completed. Check the creator’s current publication for later changes.