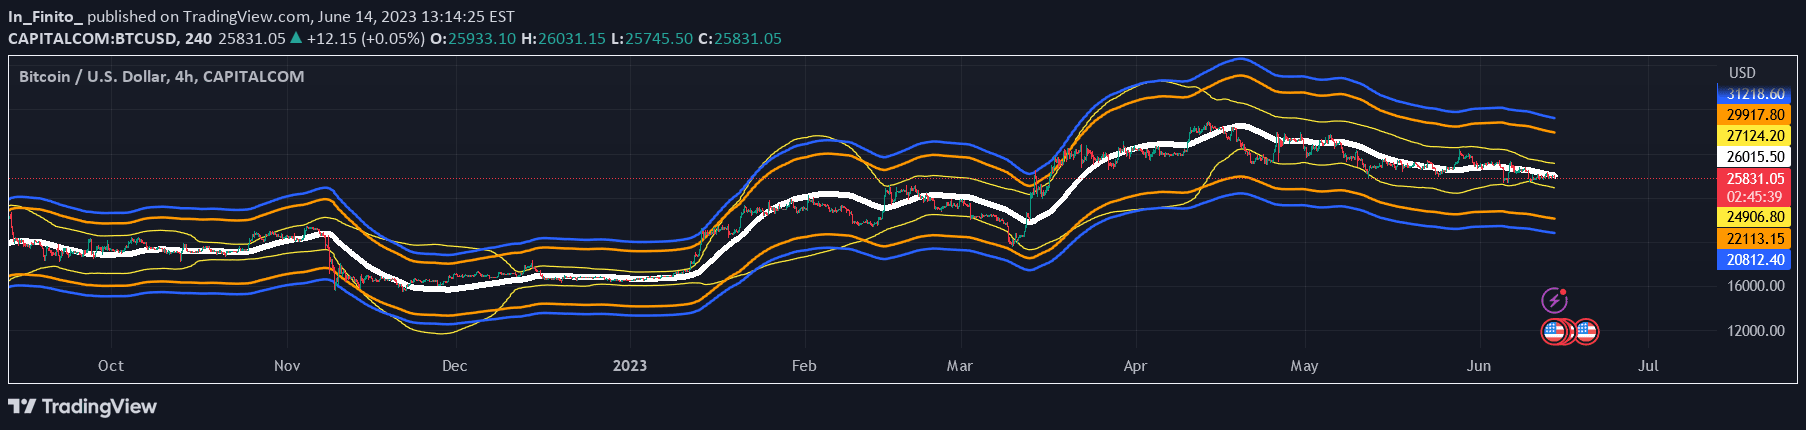
A Bollinger Bands-based indicator that uses SMA 20 and Fibonacci logarithmic levels to identify potential support and resistance zones in price movement.
Explore complementary indicator rolesHow it works
This indicator starts by calculating the 20-period Simple Moving Average (SMA) as the central line for price analysis. It then plots standard Bollinger Bands using a customizable standard deviation, which typically varies by asset (e.g., 2.61 for BTC, 2.55 for ETH).
Around the SMA and Bollinger Bands, the indicator generates multiple Fibonacci logarithmic levels. These levels include retracement and expansion levels at 0.382, 0.618, 1, and 1.618, providing a comprehensive framework for potential support and resistance zones.
Why it may be useful
Traders benefit from this indicator's multi-layered approach to identifying potential price movement zones. By combining Bollinger Bands with Fibonacci logarithmic levels, it offers a more nuanced view of potential market dynamics than traditional single-indicator methods.
The multiple levels provide traders with a range of potential entry, exit, and stop-loss points, enhancing decision-making precision. This approach helps traders understand both trend direction and potential reversal points across different timeframes.
When to explore it
This indicator is most effective in markets with clear trending or ranging behaviors, where price tends to respect technical levels. It works particularly well in cryptocurrency and forex markets, which often exhibit strong technical patterns.
Traders should use this indicator in conjunction with other technical and fundamental analysis tools to confirm signals. It is especially useful during periods of moderate to high volatility, where price is likely to respect these calculated support and resistance levels.
Keep exploring
What we’ve verified
Access, alerts and repainting behaviour have not been independently verified for this indicator. Check the creator’s current publication and settings.
General descriptions and classifications are recovered research. Verified details above identify the specific checks we have completed. Check the creator’s current publication for later changes.