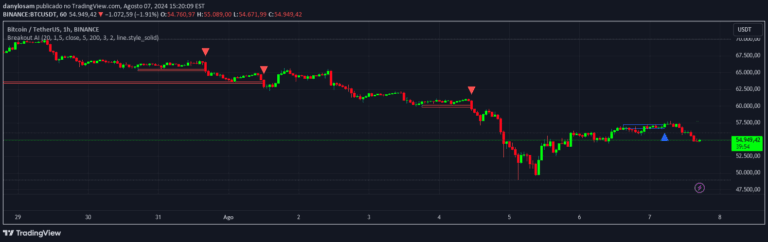
A trading strategy that identifies price breakouts during the London session by tracking price movements relative to the 10 AM candle's high and low levels.
Explore complementary indicator rolesHow it works
The strategy focuses on the London trading session, specifically monitoring price action between 09:59 AM and 01:59 PM UTC+3. Traders capture the high and low of the 10 AM candle as reference points for potential breakout opportunities. The indicator then tracks subsequent price movements to determine whether a bullish or bearish breakout occurs.
When the price breaks above the 10 AM candle's high, a bullish signal is generated, and candles are colored green. Conversely, when the price breaks below the 10 AM candle's low, a bearish signal is triggered, and candles are colored red. This visual method helps traders quickly identify potential trend continuation or reversal signals during the London session.
Why it may be useful
This strategy provides traders with a structured approach to identifying potential breakout opportunities during a highly liquid trading session. By focusing on the London session, traders can leverage increased market volatility and trading volume to make more informed decisions. The color-coded candles offer an intuitive visual representation of price movements, making it easier to spot significant market shifts.
The signal is particularly valuable because it helps traders recognize momentum changes and potential trend developments quickly. By using the 10 AM candle as a reference point, the strategy offers a systematic method for evaluating market dynamics, reducing emotional decision-making and providing a clear framework for entry and exit points.
When to explore it
The London session breakout strategy is most effective during periods of high market liquidity and volatility, typically when multiple financial centers are actively trading. Traders should use this signal during the specified time frame (09:59 AM to 01:59 PM UTC+3) when European markets are most active. It works best in markets with consistent trading volumes and clear price movements.
Ideal market conditions include currency pairs involving the Euro, British Pound, and other European instruments. Traders should be cautious during low-volume periods, major economic announcements, or when unexpected global events might disrupt normal market behavior. Combining this strategy with additional technical or fundamental analysis can enhance its reliability and effectiveness.
Keep exploring
What we’ve verified
Access, alerts and repainting behaviour have not been independently verified for this indicator. Check the creator’s current publication and settings.
General descriptions and classifications are recovered research. Verified details above identify the specific checks we have completed. Check the creator’s current publication for later changes.