
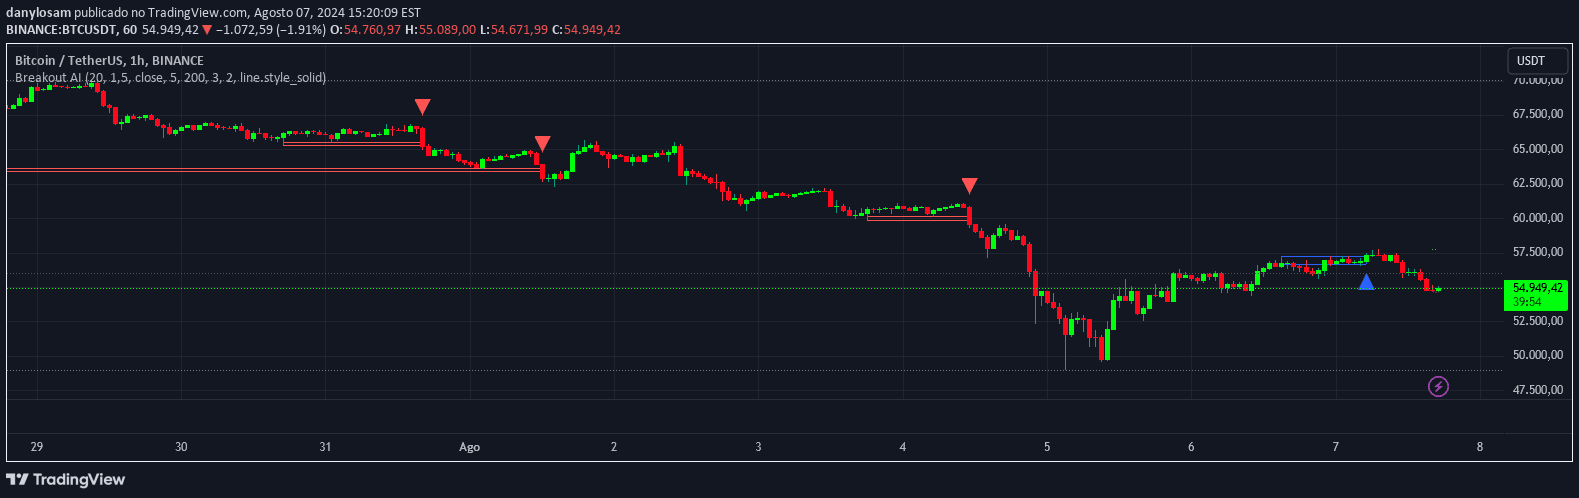
An advanced trading script that detects market breakouts using pivot points and adaptive moving averages, providing dynamic entry and exit signals for traders.
Explore complementary indicator rolesHow it works
The breakout detection script operates by analyzing pivot highs and lows over a user-defined period to identify significant support and resistance levels. It employs an adaptive moving average technique that calculates the differences between fast and slow exponential moving averages, creating a dynamic trend measurement mechanism.
The script generates buy and sell signals by monitoring these breakout levels and comparing them against the adaptive moving average. When a breakout occurs beyond established pivot points, the system plots visual indicators like green or red arrows to signal potential trading opportunities, helping traders quickly recognize market movement patterns.
Why it may be useful
The script provides traders with a sophisticated approach to identifying market breakouts by combining traditional technical analysis methods with adaptive machine learning techniques. Its ability to dynamically adjust to changing market conditions reduces the likelihood of false signals and enhances trading decision-making.
By integrating pivot point analysis with an adaptive moving average, the script offers a more responsive and nuanced view of market trends. This approach helps traders capture potential entry and exit points more effectively, giving them a strategic advantage in understanding complex market movements.
When to explore it
This breakout detection script is most effective in markets experiencing significant price movements and clear trend transitions. It performs exceptionally well in volatile markets where traditional static indicators might generate less reliable signals. Traders can benefit from its adaptive nature across different timeframes and asset classes.
The script is particularly useful during periods of market consolidation or when assets are testing critical support and resistance levels. Traders should combine this tool with other technical and fundamental analysis methods to validate signals and improve overall trading strategy precision.
Keep exploring
What we’ve verified
Access, alerts and repainting behaviour have not been independently verified for this indicator. Check the creator’s current publication and settings.
General descriptions and classifications are recovered research. Verified details above identify the specific checks we have completed. Check the creator’s current publication for later changes.


