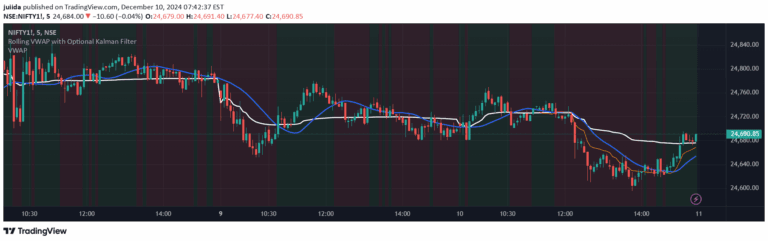
A multi-timeframe VWAP indicator that plots Volume Weighted Average Price across session, weekly, and monthly timeframes to help traders identify market value zones and institutional levels.
Explore complementary indicator rolesHow it works
The VWAP indicator calculates the average price weighted by trading volume, providing a more accurate representation of the true market price. It plots lines on the chart that represent the cumulative volume-weighted price across different timeframes, including daily session, weekly, and monthly periods.
By integrating volume into price calculation, the indicator creates dynamic reference lines that show where price has been trading most significantly. Traders can customize the appearance, color, and style of each VWAP line, allowing for personalized visual analysis of market dynamics and price behavior.
Why it may be useful
VWAP helps traders understand the true market value by incorporating volume into price calculation, which reveals where institutional traders are most active. It provides a dynamic benchmark that shows the average price traders have been willing to transact, offering insights into potential support and resistance levels.
By displaying VWAP across multiple timeframes, traders gain a comprehensive view of market sentiment and can identify key areas where price might reverse or continue trending. This tool is particularly valuable for aligning trades with volume-driven price dynamics and understanding institutional trading levels.
When to explore it
The VWAP indicator works best during periods of active trading with significant volume, such as during market opens, major economic announcements, and high-liquidity trading sessions. It is particularly effective for day traders and scalpers who need to quickly assess market value and potential price turning points.
Traders should use VWAP in conjunction with other technical analysis tools like moving averages, price action patterns, and momentum indicators to confirm signals and improve trade entry and exit decisions. It is most reliable in liquid markets with consistent volume and can help traders identify high-probability trading opportunities.
Keep exploring
What we’ve verified
Access, alerts and repainting behaviour have not been independently verified for this indicator. Check the creator’s current publication and settings.
General descriptions and classifications are recovered research. Verified details above identify the specific checks we have completed. Check the creator’s current publication for later changes.