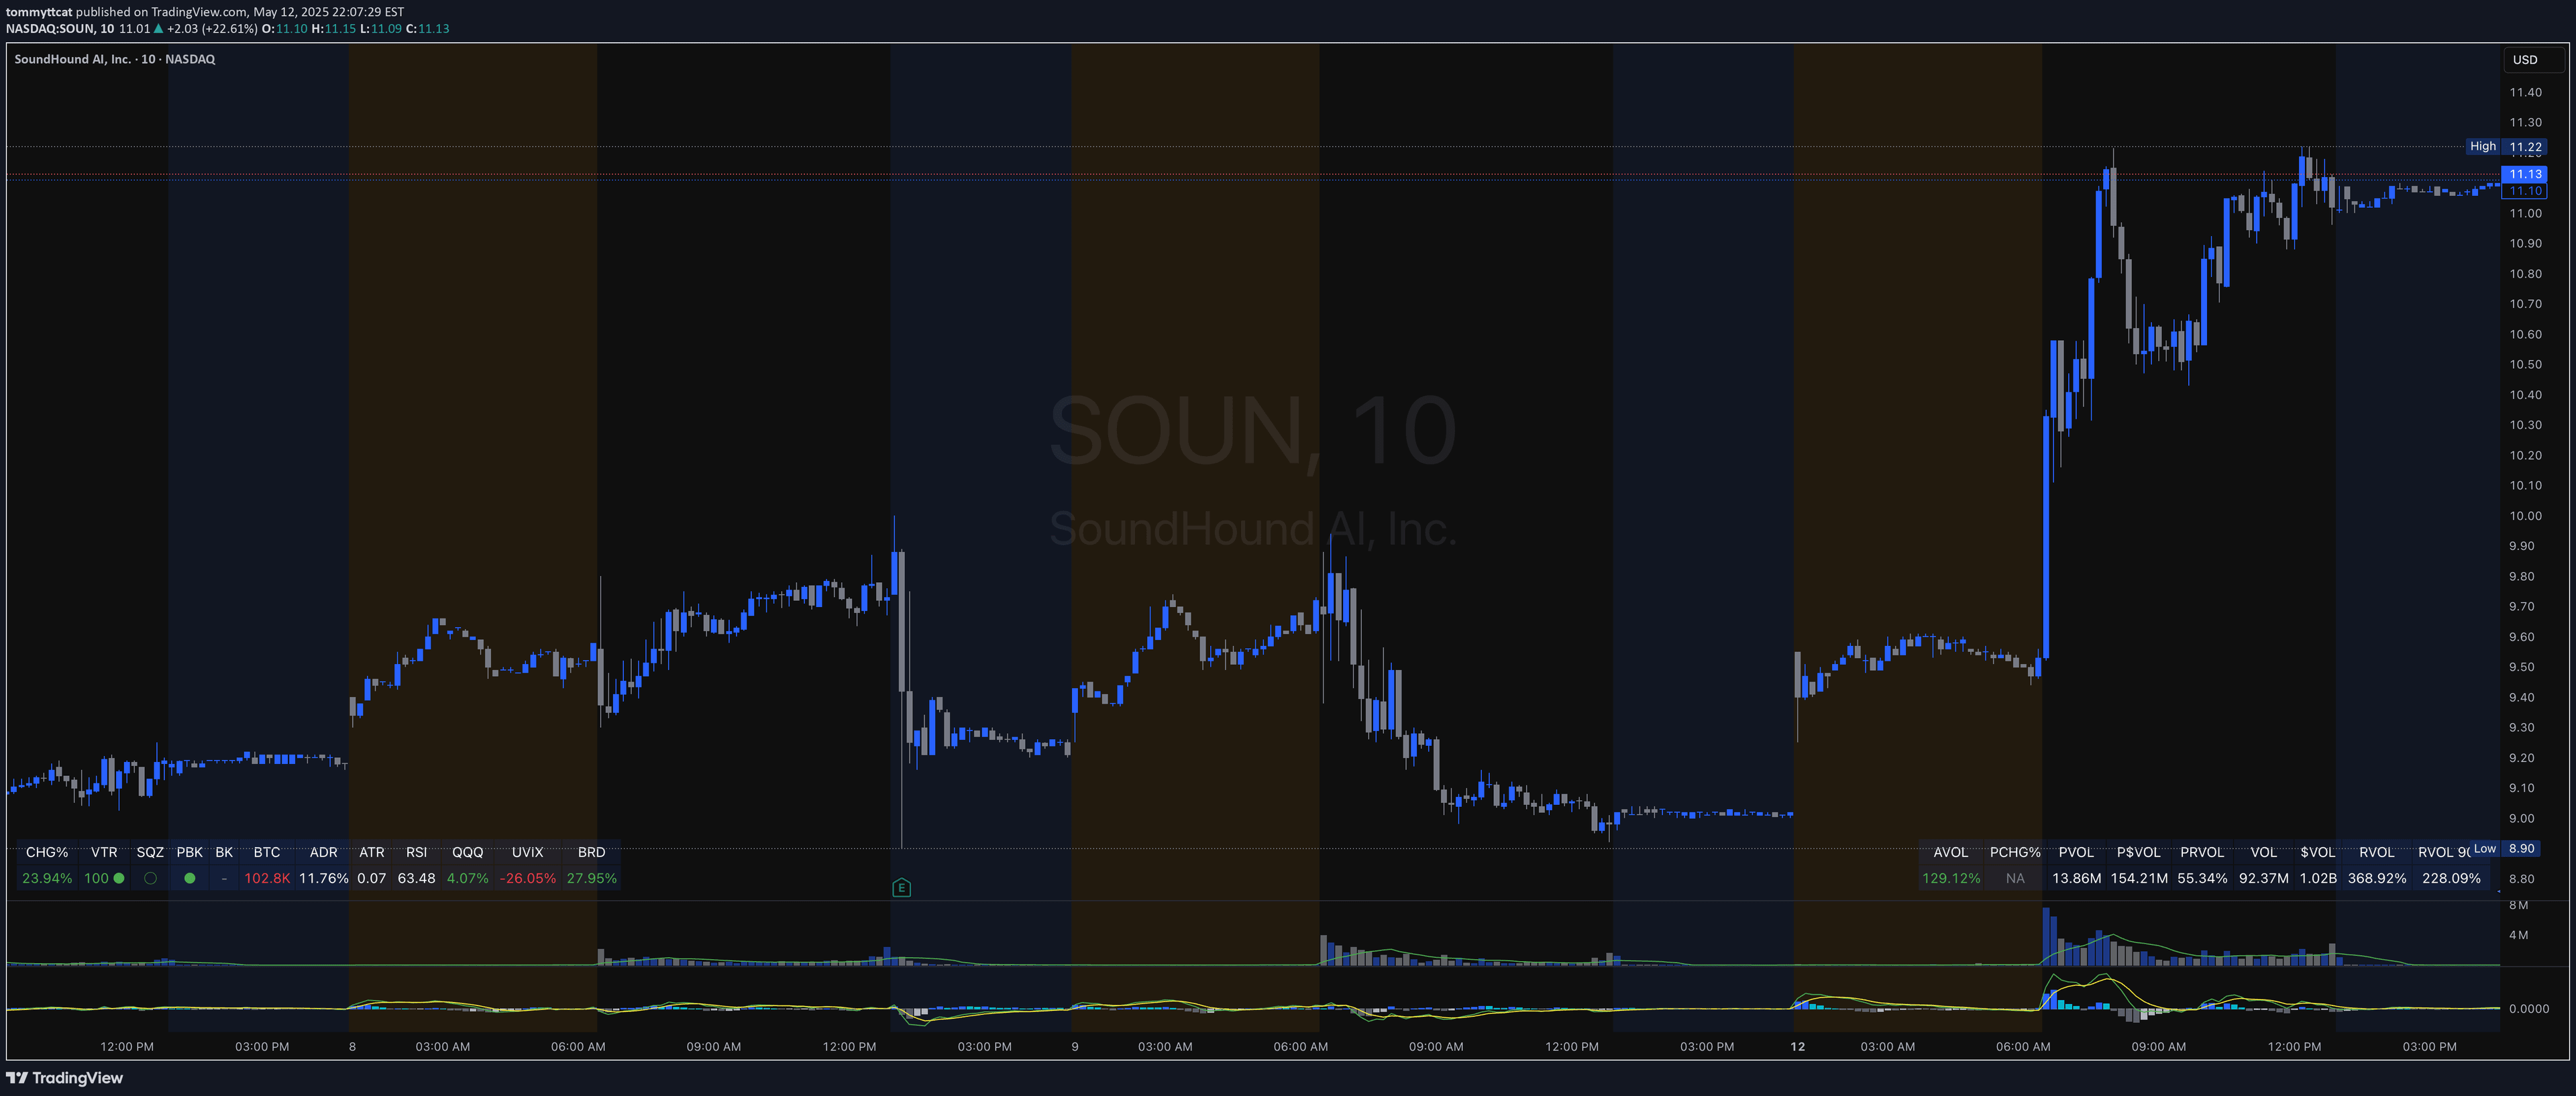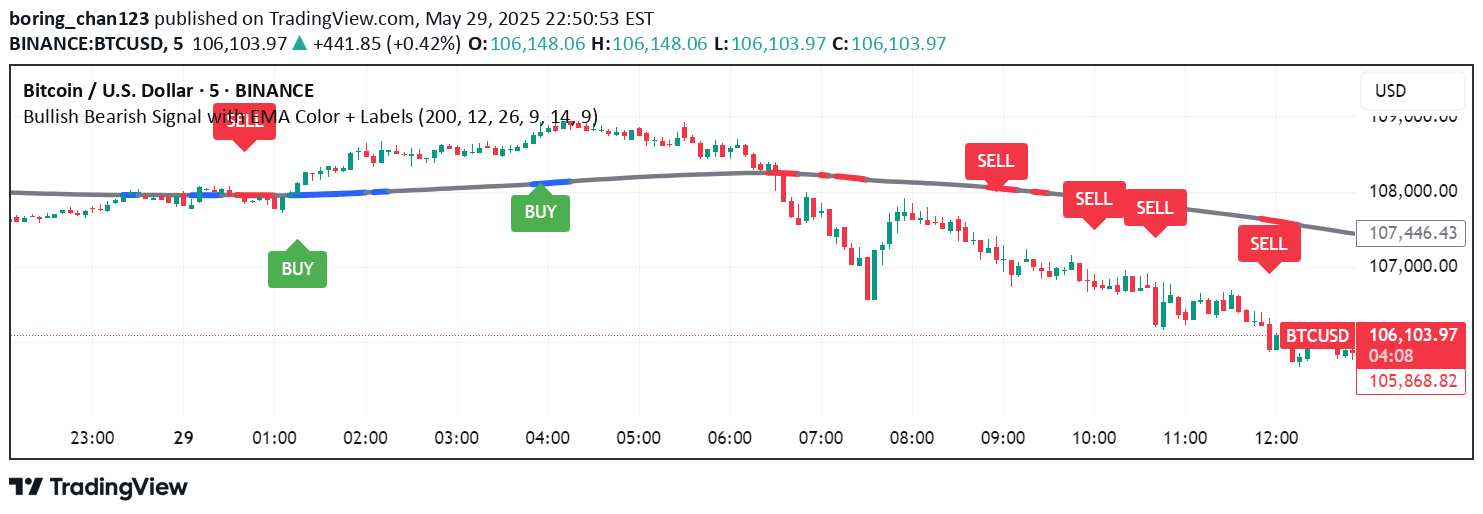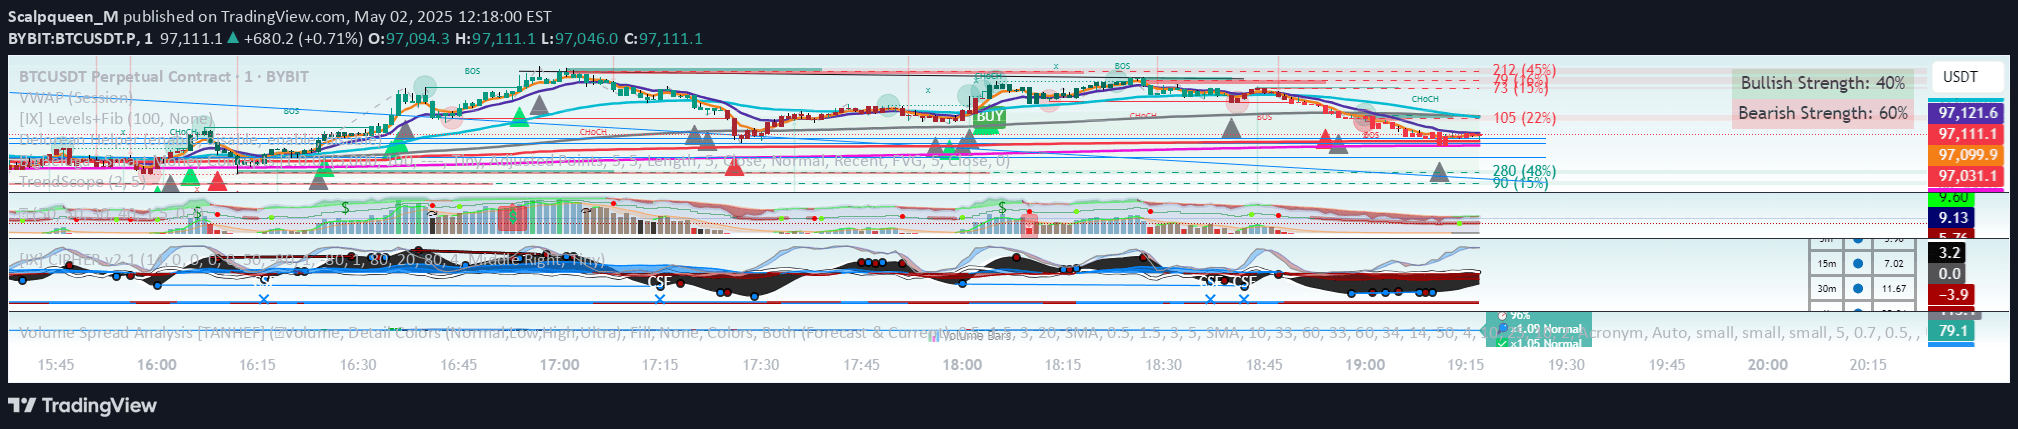
TrendScope is a multi-factor trading tool that analyzes trend structure, volume dynamics, and momentum to identify high-probability market entries and exits with advanced visual confirmation.
Explore complementary indicator rolesHow it works
TrendScope operates by analyzing multiple Exponential Moving Averages (EMAs) across different time periods to detect trend strength and alignment. It systematically examines price-volume relationships, tracking volume spikes and measuring order flow momentum to understand market dynamics.
The indicator evaluates buying and selling pressure through volume-weighted price action, identifying potential trend shifts by detecting divergences between price movement and momentum indicators. It generates visual markers like BUY/SELL labels and directional volume spikes to provide clear execution signals for traders.
Why it may be useful
TrendScope offers traders a comprehensive approach to market analysis by integrating trend, volume, and momentum insights into a single coherent framework. Its multi-factor design helps traders move beyond simplistic single-indicator strategies, providing a more nuanced understanding of market behavior and potential directional moves.
By combining different analytical perspectives, the tool reduces the risk of false signals and improves decision-making precision. Traders can gain a more holistic view of market conditions, enhancing their ability to identify high-probability trading opportunities with greater confidence.
When to explore it
TrendScope is most effective during trending market conditions where clear directional movements are present and volume dynamics play a significant role. It works best on liquid assets with consistent trading volume, such as cryptocurrencies, forex pairs, commodities, and major market indices.
The indicator is particularly valuable for swing traders seeking to capture multi-day price movements and confirm trend integrity. Traders should use it in conjunction with 4H, 8H, 12H, and daily timeframes to validate potential entry and exit points during sustained market trends.
Keep exploring
What we’ve verified
Access, alerts and repainting behaviour have not been independently verified for this indicator. Check the creator’s current publication and settings.
General descriptions and classifications are recovered research. Verified details above identify the specific checks we have completed. Check the creator’s current publication for later changes.