
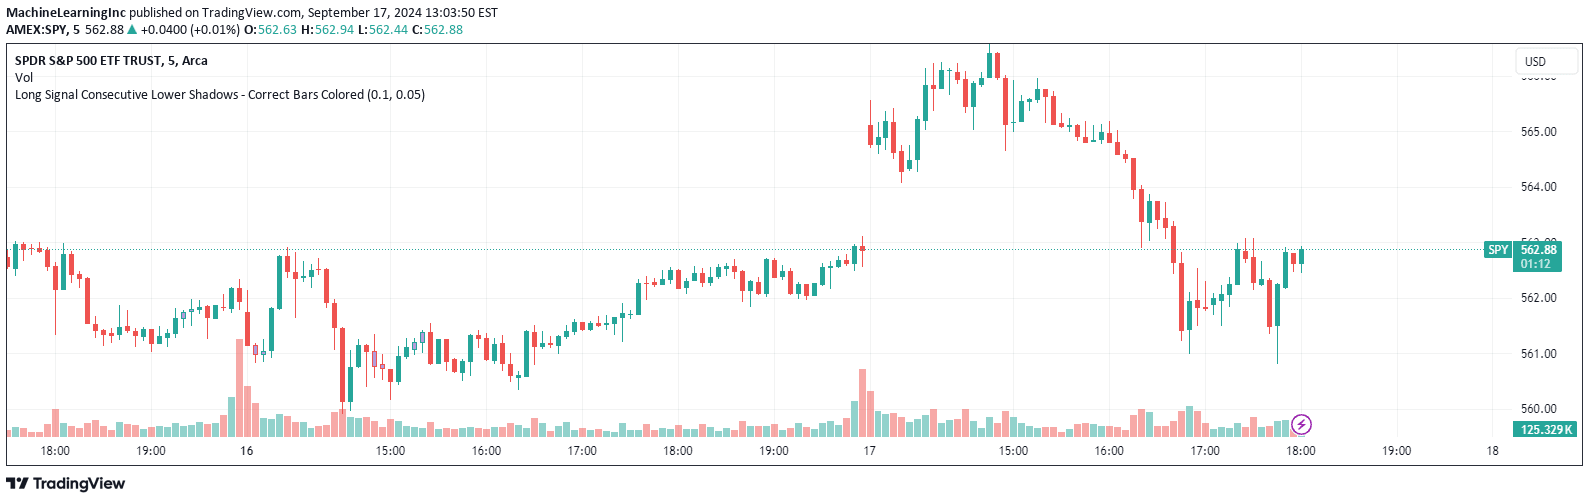
A TradingView script that identifies consecutive lower shadows on candlesticks, highlighting potential price rejection and market reversal opportunities through customizable settings.
Explore complementary indicator rolesHow it works
The script analyzes consecutive candlesticks by measuring the length of their lower shadows and comparing the price levels between them. It uses two primary thresholds: a minimum lower shadow length and a maximum allowable price difference between consecutive lows.
When these conditions are met, the script triggers a visual indication by coloring the candlesticks, typically in green. This coloring helps traders quickly identify potential price rejection patterns and areas where selling pressure might be weakening.
Why it may be useful
Lower shadow identification provides traders with valuable insights into market sentiment and potential trend reversals. By highlighting instances where prices are rejected at lower levels, the script helps traders recognize moments of potential bullish momentum or buying opportunities.
The customizable thresholds allow traders to adapt the signal to different market conditions and trading styles, making it a flexible tool for analyzing price action and identifying potential entry points.
When to explore it
This signal works best in markets with clear trending or consolidating price action, where lower shadows can indicate potential trend reversals or continuation patterns.
It is particularly effective in volatile markets where price rejection signals are more pronounced. Traders should combine this signal with other technical indicators and fundamental analysis to confirm potential trading opportunities and minimize false signals.
Keep exploring
What we’ve verified
Access, alerts and repainting behaviour have not been independently verified for this indicator. Check the creator’s current publication and settings.
General descriptions and classifications are recovered research. Verified details above identify the specific checks we have completed. Check the creator’s current publication for later changes.


