
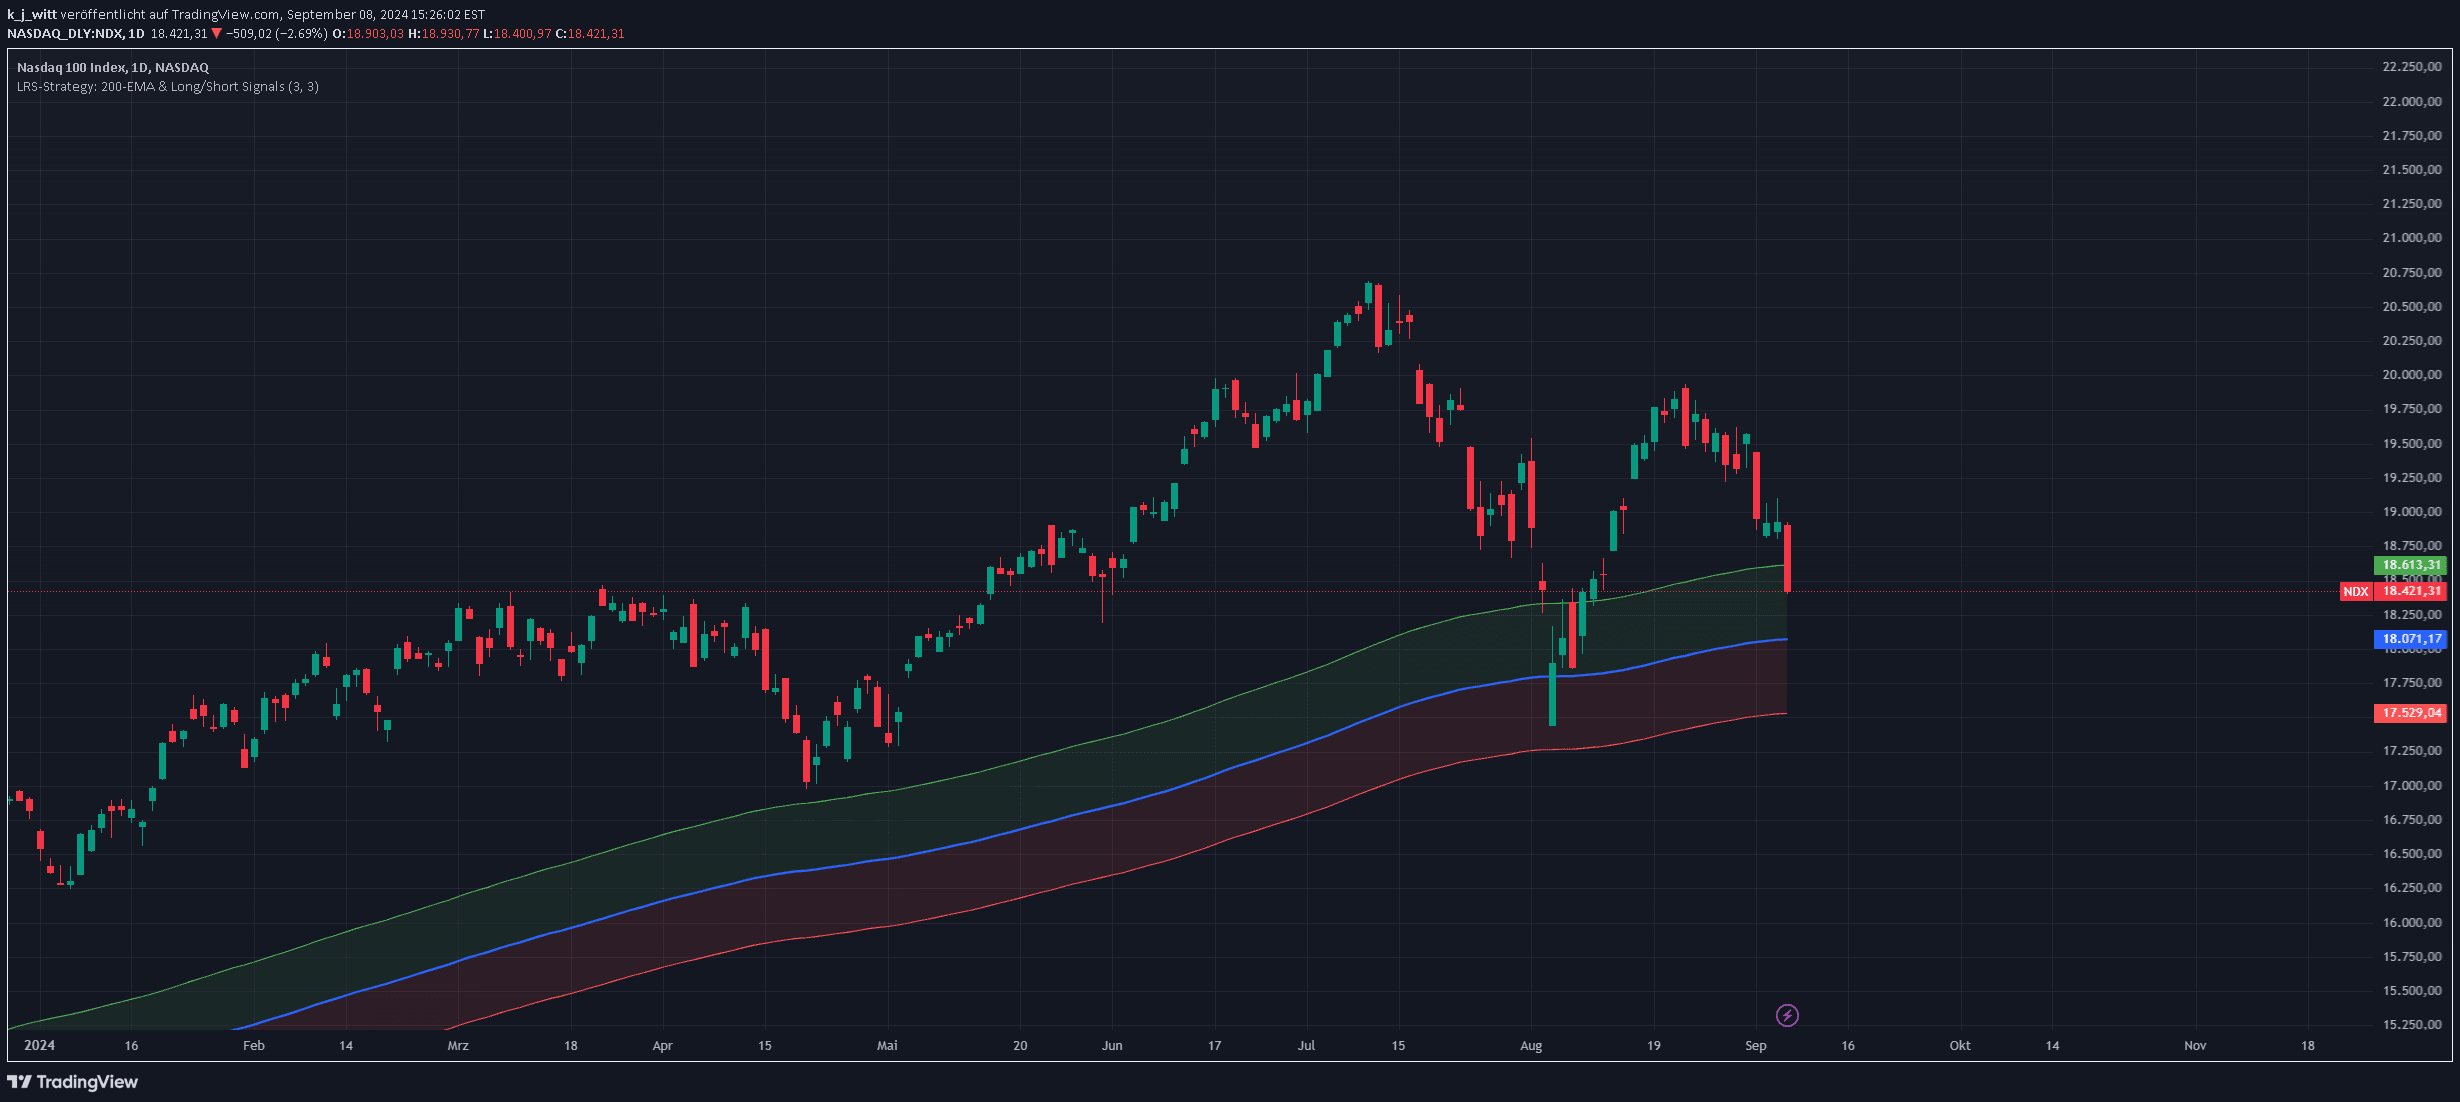
A trend-following strategy using the 200-day EMA with customizable buffer zones to generate precise long and short trading signals based on price movements.
Explore complementary indicator rolesHow it works
The LRS strategy uses the 200-day Exponential Moving Average (EMA) as the primary trend indicator, with customizable buffer zones set around the EMA to filter out market noise. The indicator tracks price movements relative to these zones, generating signals when specific conditions are met: for a long signal, the price must move below the lower buffer, cross the 200-day EMA from below, and then break above the upper buffer.
For a short signal, the process is reversed: the price moves above the upper buffer, crosses below the 200-day EMA, and then breaks below the lower buffer. The strategy ensures alternating signals, preventing multiple signals of the same type without a clear trend reversal. This systematic approach provides traders with a structured method to identify potential entry and exit points based on long-term trend movements.
Why it may be useful
The LRS strategy offers traders a disciplined approach to trend following by using the 200-day EMA as a reliable long-term trend indicator. By incorporating buffer zones, the strategy helps minimize false signals and reduces the impact of short-term market volatility. This approach provides traders with a more robust method of identifying significant trend changes, helping to filter out minor price fluctuations.
The indicator's strength lies in its ability to provide clear, objective trading signals based on well-defined rules. By focusing on longer-term trend movements, traders can potentially reduce emotional decision-making and develop a more systematic trading approach. The customizable buffer zones allow for additional flexibility, enabling traders to adapt the strategy to different market conditions and personal risk tolerance.
When to explore it
The LRS strategy is most effective in markets with clear trending characteristics, where prices are making sustained moves in a particular direction. It works best in markets with moderate to strong trends, such as major stock indices, forex pairs, or commodities that exhibit consistent directional movements. Traders should be particularly attentive to this strategy during periods of economic stability or when there are clear fundamental drivers supporting a specific market trend.
The indicator is less suitable for highly volatile or choppy markets where price movements are erratic and lack clear directional momentum. Traders should combine this strategy with other technical and fundamental analysis tools to confirm signals and improve overall trading decision-making. It is particularly valuable for swing traders and investors looking to capture longer-term trend movements while minimizing the impact of short-term market noise.
Keep exploring
What we’ve verified
Access, alerts and repainting behaviour have not been independently verified for this indicator. Check the creator’s current publication and settings.
General descriptions and classifications are recovered research. Verified details above identify the specific checks we have completed. Check the creator’s current publication for later changes.


