
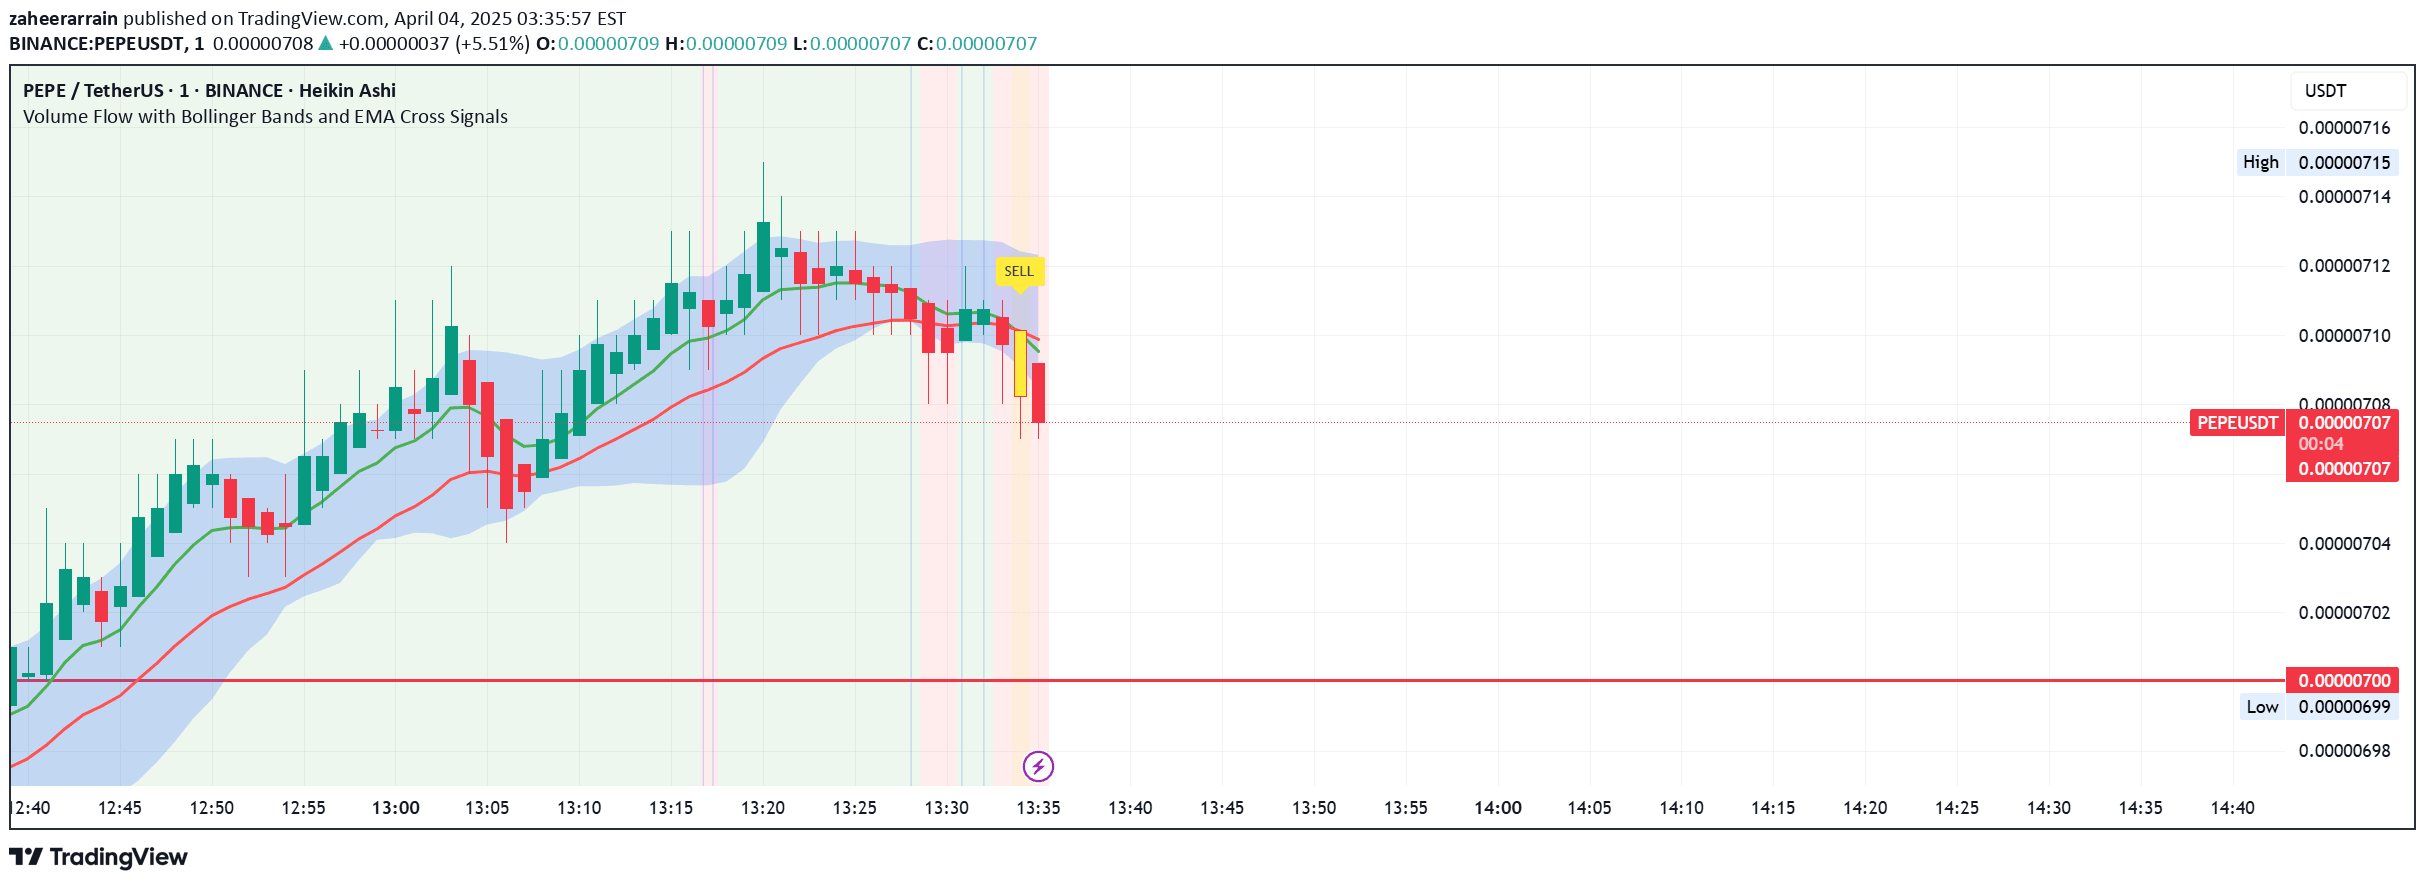
A multi-component trading indicator that combines volume flow, Bollinger Bands, and EMA crossovers to generate precise buy and sell signals with visual market trend confirmation.
Explore complementary indicator rolesHow it works
The Volume Flow with Bollinger Bands and EMA Cross Signals indicator generates trading signals by analyzing multiple technical components simultaneously. It calculates volume flow by multiplying price changes with trading volume and smoothing the result, creating a measure of market buying or selling pressure.
The indicator simultaneously tracks Exponential Moving Average (EMA) crossovers and Bollinger Bands to confirm signal strength. When the fast EMA crosses above the slow EMA, a bullish signal is generated, while a cross below indicates a bearish signal. Bollinger Bands help validate these signals by showing potential overbought or oversold market conditions.
Why it may be useful
This comprehensive indicator provides traders with a multi-layered approach to market analysis, reducing the likelihood of false signals by combining volume, price momentum, and trend indicators. It offers visual confirmation through color-coded backgrounds and candles, making market sentiment immediately recognizable to traders.
By integrating volume flow, EMA crossovers, and Bollinger Bands, the indicator offers a holistic view of market dynamics. Traders can quickly assess buying and selling pressures, identify potential trend reversals, and make more informed trading decisions based on multiple technical analysis components.
When to explore it
The indicator is most effective in markets with clear trending characteristics and moderate to high trading volumes. It works exceptionally well in liquid markets like major forex pairs, large-cap stocks, and prominent cryptocurrency pairs where volume and price movements are consistent and predictable.
Traders should use this signal during stable market hours with regular trading activity, avoiding periods of extreme volatility or low liquidity. It is particularly useful for short to medium-term trading strategies, offering precise entry and exit points by combining multiple technical analysis methods.
Keep exploring
What we’ve verified
Access, alerts and repainting behaviour have not been independently verified for this indicator. Check the creator’s current publication and settings.
General descriptions and classifications are recovered research. Verified details above identify the specific checks we have completed. Check the creator’s current publication for later changes.


