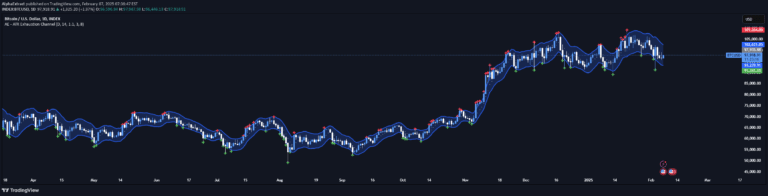
A dynamic trend and volatility indicator that combines Least Squares Moving Average with Average True Range to detect trend direction and market volatility with adaptive boundaries.
Explore complementary indicator rolesHow it works
The Lsma ATR indicator operates by calculating a Least Squares Moving Average (LSMA) over a specified length, creating a smoothed trend line that tracks price direction with minimal lag. It simultaneously computes the Average True Range (ATR) to measure market volatility, generating upper and lower boundaries around the LSMA line.
These volatility-adjusted boundaries dynamically expand or contract based on market conditions, providing a responsive framework for trend analysis. When price crosses above the upper boundary, it signals a potential upward trend, while crossing below the lower boundary indicates a possible downward trend, offering traders clear visual and quantitative insights into market movement.
Why it may be useful
The Lsma ATR is crucial for traders seeking a nuanced approach to trend detection that accounts for market volatility. By combining trend tracking with volatility measurement, it helps traders reduce noise in price data and avoid false signals, providing a more reliable mechanism for identifying potential market shifts.
This indicator's ability to adapt to changing market conditions makes it valuable across different trading styles and timeframes. Traders can use it to confirm trend direction, manage risk, and make more informed decisions about market entry and exit points, ultimately improving their strategic approach to trading.
When to explore it
The Lsma ATR is most effective in markets experiencing clear directional movements with identifiable volatility patterns. It performs exceptionally well in trending markets where price shows consistent directional movement, allowing traders to capitalize on sustained price momentum while managing risk through its dynamic volatility boundaries.
Traders should consider using this indicator during periods of moderate to high market volatility, such as during economic announcements, earnings reports, or significant market events. It is particularly useful in markets like stocks, forex, and cryptocurrencies where rapid price changes and trend reversals are common.
Keep exploring
What we’ve verified
Access, alerts and repainting behaviour have not been independently verified for this indicator. Check the creator’s current publication and settings.
General descriptions and classifications are recovered research. Verified details above identify the specific checks we have completed. Check the creator’s current publication for later changes.