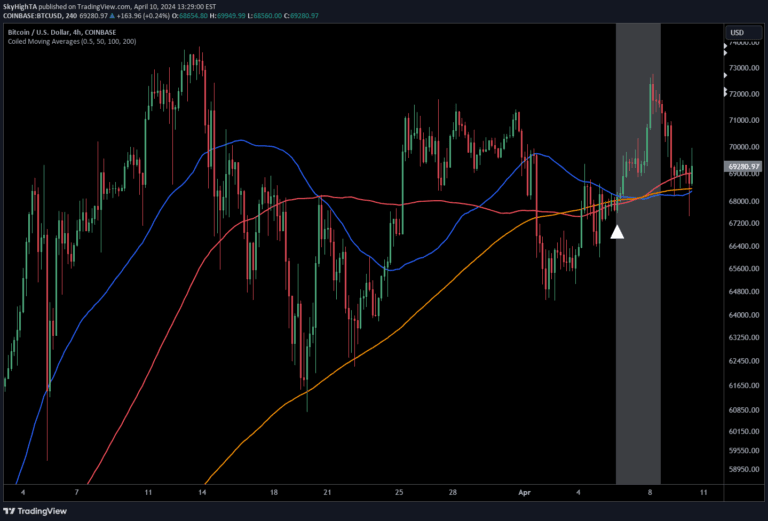
An advanced moving average crossover strategy that uses Average True Range to filter signals, providing more reliable trend confirmation by adapting to market volatility.
Explore complementary indicator rolesHow it works
The indicator calculates the difference between a fast and slow moving average, comparing this difference against the Average True Range (ATR) multiplied by a custom factor. When the MA difference exceeds the ATR threshold, it generates a trend signal, distinguishing between bullish, bearish, and neutral market states.
This approach uses adaptive volatility filtering to prevent false signals in choppy markets. By incorporating ATR, the indicator dynamically adjusts its sensitivity, ensuring that only significant price movements trigger trend confirmations.
Why it may be useful
Traditional moving average crossovers often generate numerous false signals, leading traders to make premature or incorrect trading decisions. By integrating volatility measurements, this indicator provides a more sophisticated approach to trend identification, reducing noise and improving signal reliability.
The strategy's adaptive nature allows traders to customize inputs like MA types and ATR parameters, making it versatile across different market conditions and trading styles. This flexibility enables more precise trend detection and helps traders avoid unnecessary trades during market uncertainty.
When to explore it
This signal works best in trending markets with clear directional movements, where volatility plays a significant role in price action. It is particularly effective for traders seeking to filter out minor market fluctuations and focus on more substantial trend changes.
The indicator is ideal for multiple timeframes and asset classes, offering value to trend traders, momentum investors, and those looking to add a robust confirmation layer to their existing trading strategies. Its adaptability makes it suitable for both short-term and longer-term trading approaches.
Keep exploring
What we’ve verified
Access, alerts and repainting behaviour have not been independently verified for this indicator. Check the creator’s current publication and settings.
General descriptions and classifications are recovered research. Verified details above identify the specific checks we have completed. Check the creator’s current publication for later changes.