
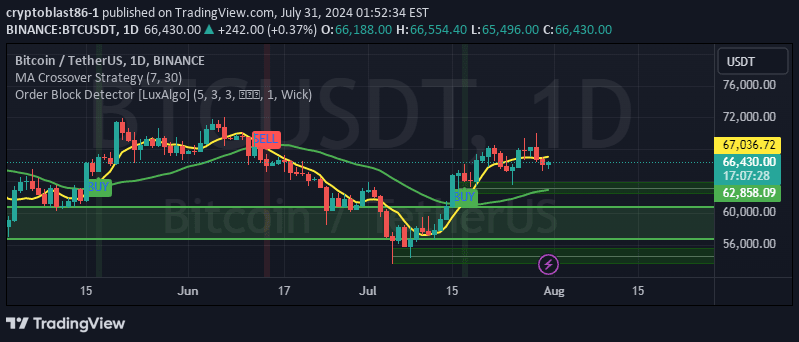
A simple trading strategy using moving average crossovers between 7-period and 30-period MAs to generate buy and sell signals across multiple timeframes.
Explore complementary indicator rolesHow it works
The moving average crossover strategy operates by tracking the interaction between two moving averages with different periods: a shorter 7-period MA and a longer 30-period MA. When the faster 7-period MA crosses above the slower 30-period MA, it generates a buy signal, indicating potential bullish momentum. Conversely, when the 7-period MA crosses below the 30-period MA, it triggers a sell signal, suggesting bearish market conditions.
Traders monitor these crossover points as potential entry and exit signals, using them to identify trend changes and potential trading opportunities. The strategy relies on the principle that shorter-term moving averages react more quickly to price changes, while longer-term moving averages provide a smoother, more stable trend perspective.
Why it may be useful
Moving average crossover strategies are crucial for traders seeking to understand market trends and potential momentum shifts. By using two moving averages with different periods, traders can gain insights into market dynamics that might not be immediately apparent from raw price action. The strategy helps identify potential trend reversals and provides a systematic approach to entry and exit points.
This method is particularly valuable because it offers a clear, rules-based trading approach that removes emotional decision-making. The crossover signals provide traders with objective indicators of potential market movements, helping them make more informed trading decisions across various financial instruments and timeframes.
When to explore it
The moving average crossover strategy works best on longer timeframes like 4-hour and daily charts, where trend signals are more reliable and less prone to short-term noise. These timeframes allow traders to capture more significant market movements and reduce the impact of minor price fluctuations. The strategy is particularly effective in trending markets where clear directional movements are present.
Traders should be cautious in highly volatile or ranging markets, where crossover signals might produce more false positives. It's recommended to combine this strategy with other technical indicators or fundamental analysis to confirm signals and improve overall trading accuracy. Additionally, implementing proper risk management techniques and setting appropriate stop-loss levels can help mitigate potential losses.
Keep exploring
What we’ve verified
Access, alerts and repainting behaviour have not been independently verified for this indicator. Check the creator’s current publication and settings.
General descriptions and classifications are recovered research. Verified details above identify the specific checks we have completed. Check the creator’s current publication for later changes.


