
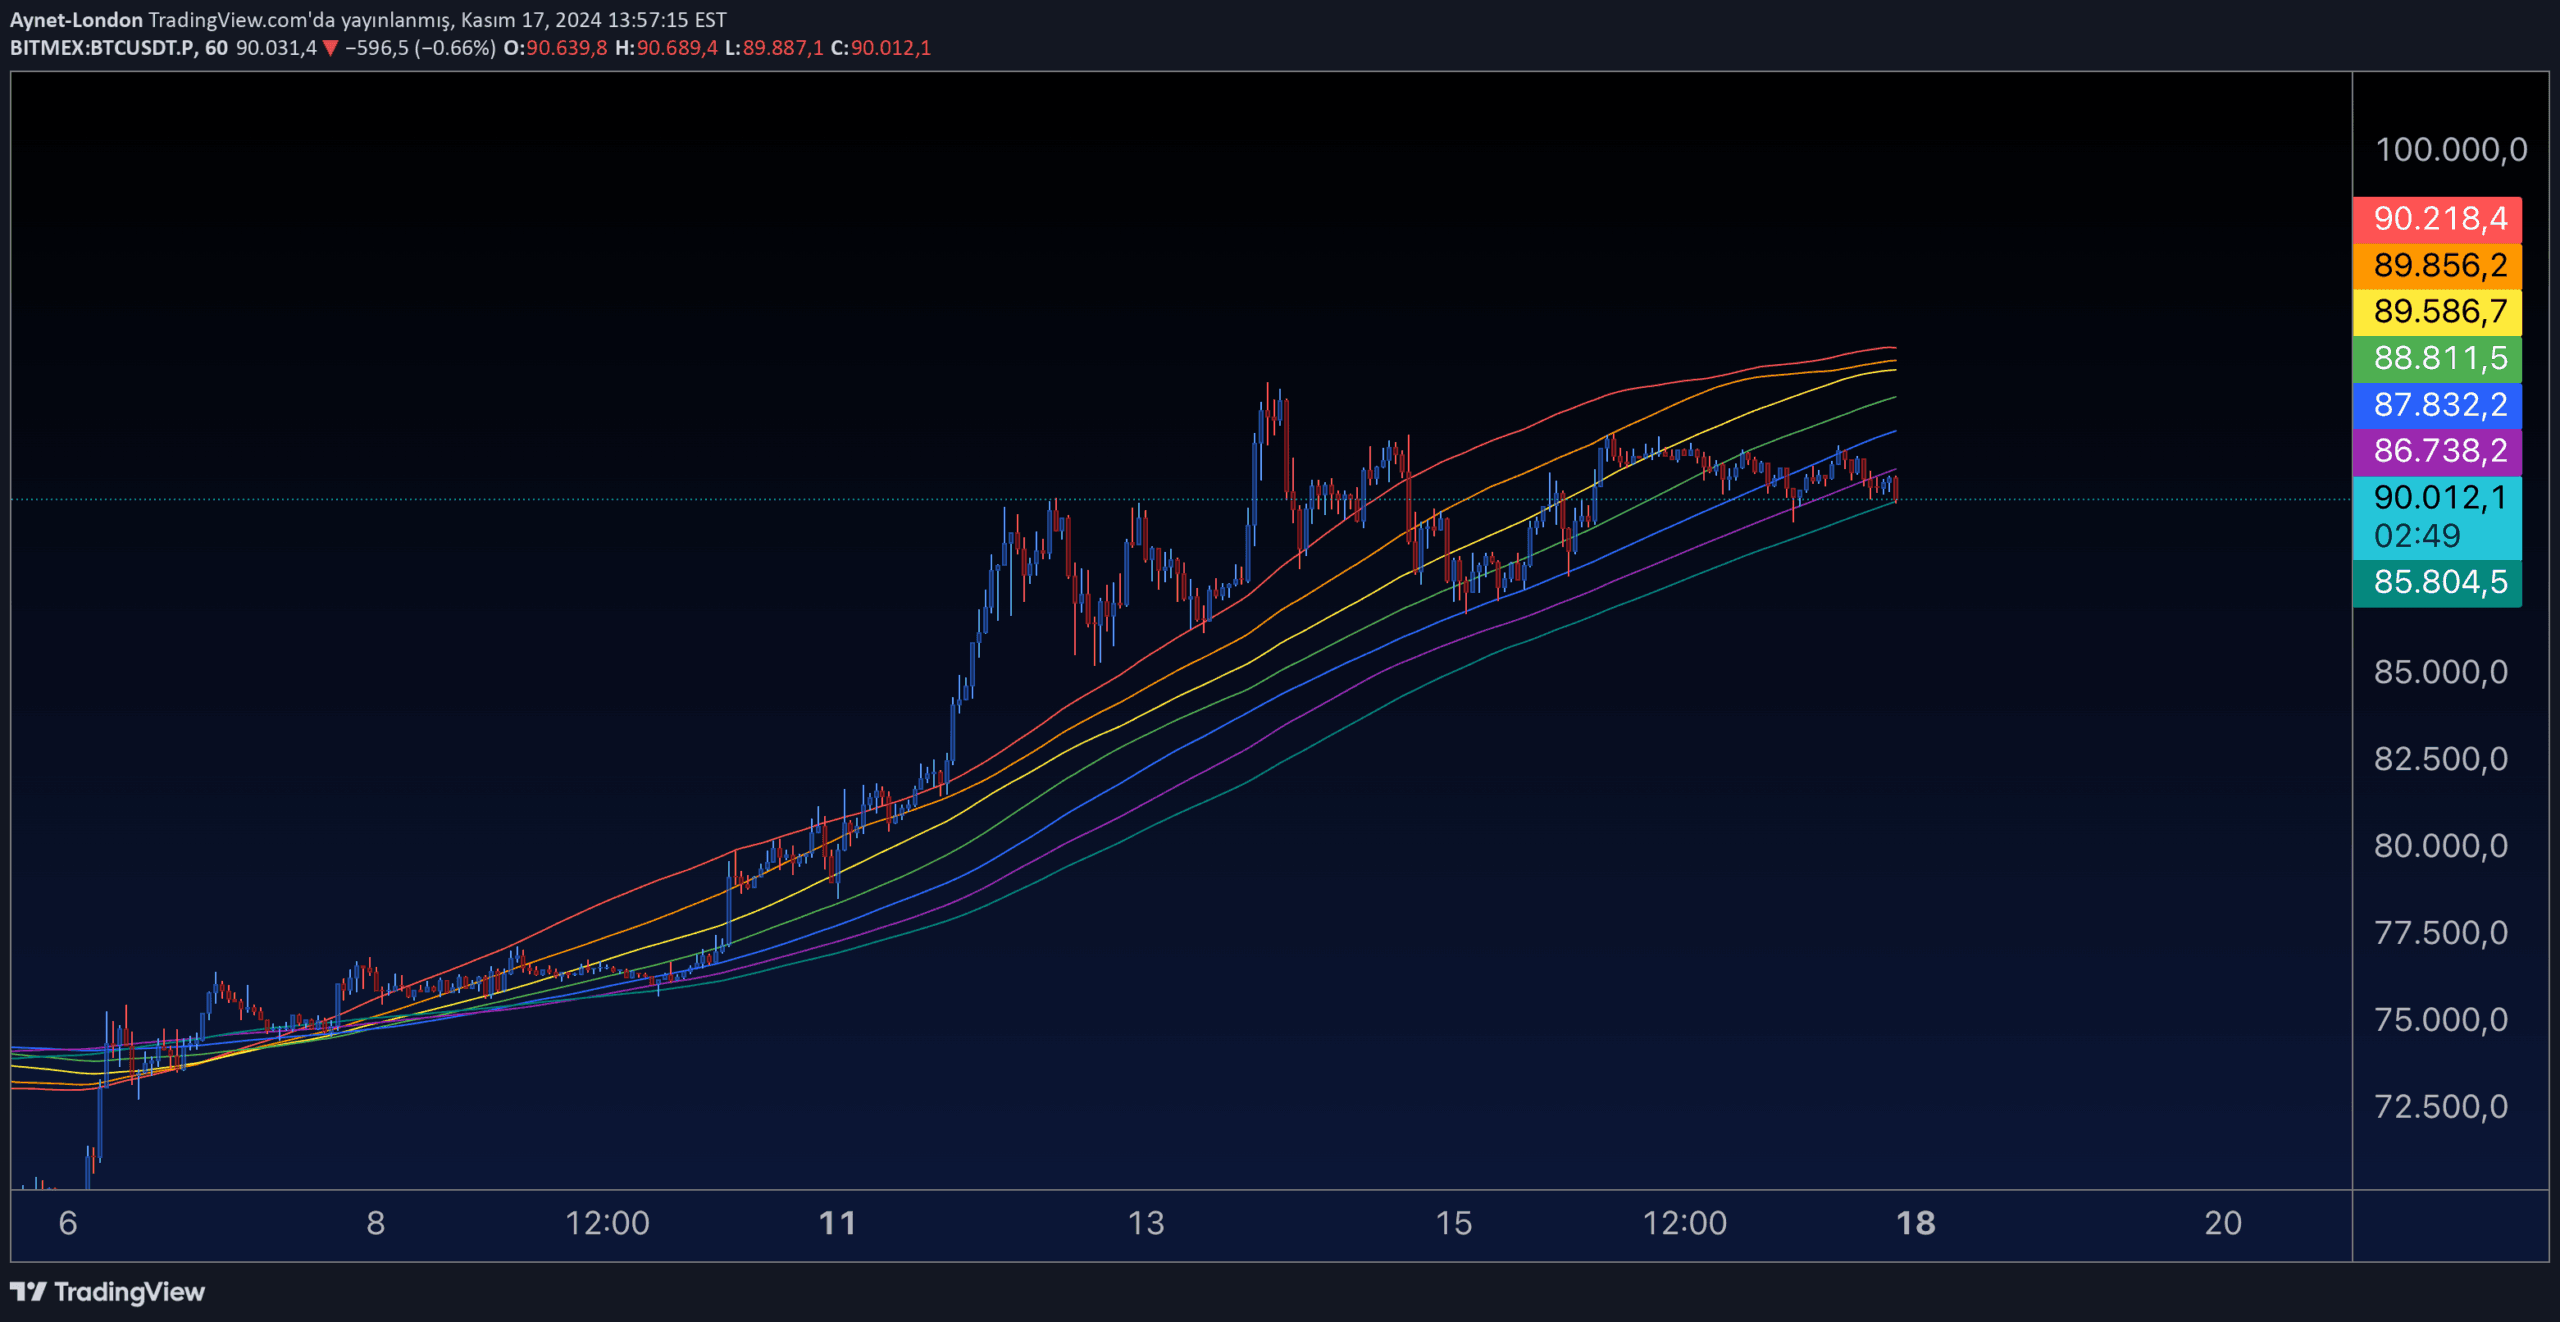
A multi-layered moving average indicator that visualizes price trends using rainbow-colored bands of varying lengths to help traders analyze market momentum and potential support/resistance zones.
Explore complementary indicator rolesHow it works
The MA Rainbow script generates multiple moving averages with incrementally increasing lengths, starting from a base moving average length. Each band is calculated by multiplying the base length with a spacing multiplier, creating a series of moving averages that progressively extend further back in time.
Traders can customize the indicator by selecting different moving average types like Simple (SMA), Exponential (EMA), or Weighted (WMA). The bands are dynamically colored using a rainbow palette, with each band representing a different length and providing a visual representation of price trends and market momentum.
Why it may be useful
The MA Rainbow offers traders a comprehensive visual tool for understanding market trends and price dynamics. By displaying multiple moving averages simultaneously, it provides deeper insights into price movement, helping traders identify potential trend directions and momentum shifts more effectively than traditional single moving average approaches.
The colorful, multi-layered presentation allows traders to quickly interpret market conditions, with each band offering a different perspective on price trends. This approach helps traders make more informed decisions by revealing subtle changes in market behavior that might be missed with conventional single-indicator analysis.
When to explore it
The MA Rainbow is most effective in trending markets where price shows clear directional movement. It works exceptionally well in markets with consistent momentum, helping traders identify and confirm trend strength across multiple timeframes and market conditions.
Traders should use this indicator when seeking a comprehensive view of price trends, particularly during periods of sustained market movement. It is particularly useful for analyzing stocks, forex, and cryptocurrency markets where trend identification and momentum assessment are critical for making trading decisions.
Keep exploring
What we’ve verified
Access, alerts and repainting behaviour have not been independently verified for this indicator. Check the creator’s current publication and settings.
General descriptions and classifications are recovered research. Verified details above identify the specific checks we have completed. Check the creator’s current publication for later changes.


