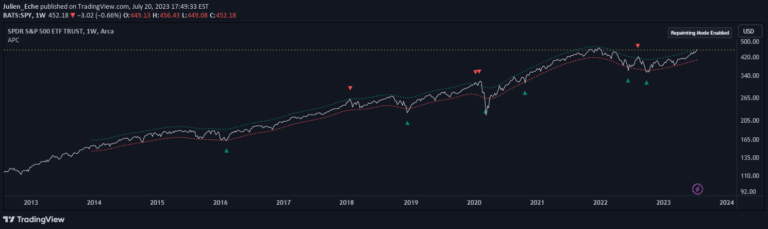
The Rainbow Indicator is a visual price action tool that creates seven color-coded bands around a moving average using standard deviation to represent price dynamics.
Explore complementary indicator rolesHow it works
The Rainbow Indicator generates a unique visualization of price movement by creating a multi-colored band system around a central moving average. It uses a Simple Moving Average (SMA) as its baseline and calculates seven distinct bands using standard deviation and a smoothing multiplier.
Each band represents a different color of the rainbow, progressively spreading outward from the central moving average. The bands are dynamically plotted, with their width and spacing controlled by user-defined parameters like length, smooth, and radius, allowing traders to customize the indicator's sensitivity and visual representation.
Why it may be useful
The Rainbow Indicator provides traders with a visually intuitive method of understanding price volatility and trend dynamics. By representing price movements through color-coded bands, it offers an immediate visual representation of market conditions, making complex price action more accessible and easier to interpret.
This innovative approach allows traders to quickly assess market volatility, trend strength, and potential price ranges. The multi-layered visualization helps identify potential support and resistance levels, trend shifts, and market momentum more effectively than traditional single-line indicators.
When to explore it
The Rainbow Indicator is most effective in markets with clear trending characteristics, particularly in short to medium-term timeframes like intraday and scalping scenarios. It works best in liquid markets with consistent price movements, such as major forex pairs, stock indices, and actively traded commodities.
Traders should use this indicator when seeking a comprehensive visual representation of price dynamics that goes beyond traditional moving average tools. It is particularly useful during periods of market transition, when identifying potential trend reversals, and when analyzing price volatility across different market conditions.
Keep exploring
What we’ve verified
Access, alerts and repainting behaviour have not been independently verified for this indicator. Check the creator’s current publication and settings.
General descriptions and classifications are recovered research. Verified details above identify the specific checks we have completed. Check the creator’s current publication for later changes.