
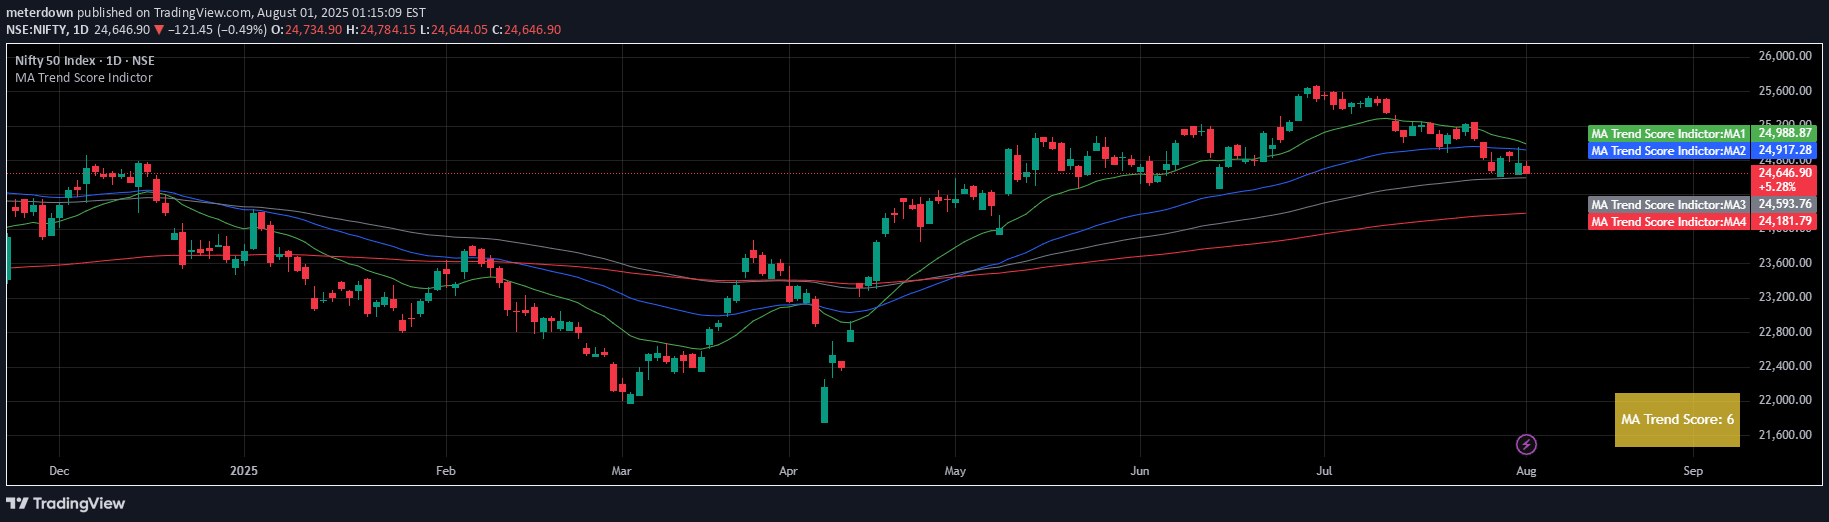
A trend score indicator that calculates market direction by comparing price to multiple exponential moving averages (EMAs) and assigning a score based on their relative positions.
Explore complementary indicator rolesHow it works
The trend score indicator works by comparing the current price and multiple exponential moving averages (EMA 20, EMA 50, EMA 100) to generate a comprehensive trend assessment. It assigns points based on price and EMA relationships, with rules that add or subtract points when certain conditions are met. Points are awarded when price is above or below specific EMAs, and when shorter-term EMAs cross longer-term EMAs
Why it may be useful
This trend score indicator provides traders with an objective and quantitative method to assess market direction and trend strength. By systematically scoring trend characteristics, it removes emotional bias from trend analysis. The score helps traders make more informed decisions about market entry, exit, and position sizing. It offers a clear, numerical representation of trend dynamics across different timeframes
When to explore it
The trend score indicator works best in trending markets with clear directional movements. It is most effective on liquid instruments with consistent price action. Traders should use this indicator for identifying potential trend strength and making strategic trading decisions. It is particularly useful for swing traders looking to understand medium-term trend dynamics and adjust their position sizing accordingly
Keep exploring
What we’ve verified
Access, alerts and repainting behaviour have not been independently verified for this indicator. Check the creator’s current publication and settings.
General descriptions and classifications are recovered research. Verified details above identify the specific checks we have completed. Check the creator’s current publication for later changes.


