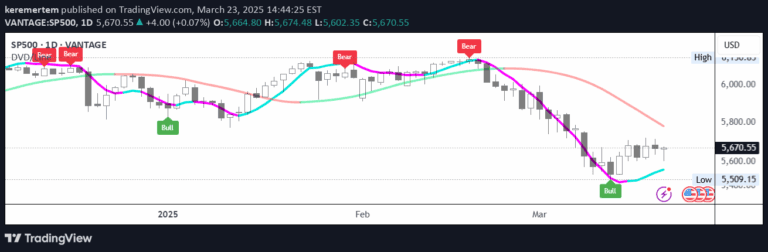
A trading signal using Moving Average Distance (MAD) Ratio and Simple Moving Averages crossover to identify potential buy and sell opportunities based on short and long-term price momentum.
Explore complementary indicator rolesHow it works
The indicator calculates the Moving Average Distance (MAD) Ratio by comparing a 21-day and 200-day Simple Moving Average (SMA). When the 21-day SMA crosses above the 200-day SMA and the MAD Ratio is greater than 1, it generates a buy signal.
Conversely, when the 21-day SMA crosses below the 200-day SMA and the MAD Ratio is less than 1, it generates a sell signal. The MAD Ratio provides insight into the relative positioning of short-term and long-term moving averages. By tracking these crossovers and the ratio between them, traders can identify potential changes in market momentum and trend direction.
Why it may be useful
This signal helps traders identify potential trend reversals and momentum shifts in the market. By combining two moving averages with different time periods, it provides a more comprehensive view of price movement than a single moving average would.
The indicator offers clear visual cues through color-coded labels and lines, making it easier for traders to quickly interpret market conditions. It helps traders make more informed decisions by highlighting potential entry and exit points based on trend changes.
When to explore it
The indicator works best in markets with clear trending characteristics, where price movements are more consistent and directional. It is particularly useful in markets with moderate volatility, where short-term and long-term trends can be more easily distinguished.
Traders should use this signal in conjunction with other technical indicators and fundamental analysis to confirm potential trading opportunities. It is most effective when applied to liquid markets with sufficient trading volume and when used across multiple timeframes to validate signal reliability.
Keep exploring
What we’ve verified
Access, alerts and repainting behaviour have not been independently verified for this indicator. Check the creator’s current publication and settings.
General descriptions and classifications are recovered research. Verified details above identify the specific checks we have completed. Check the creator’s current publication for later changes.