
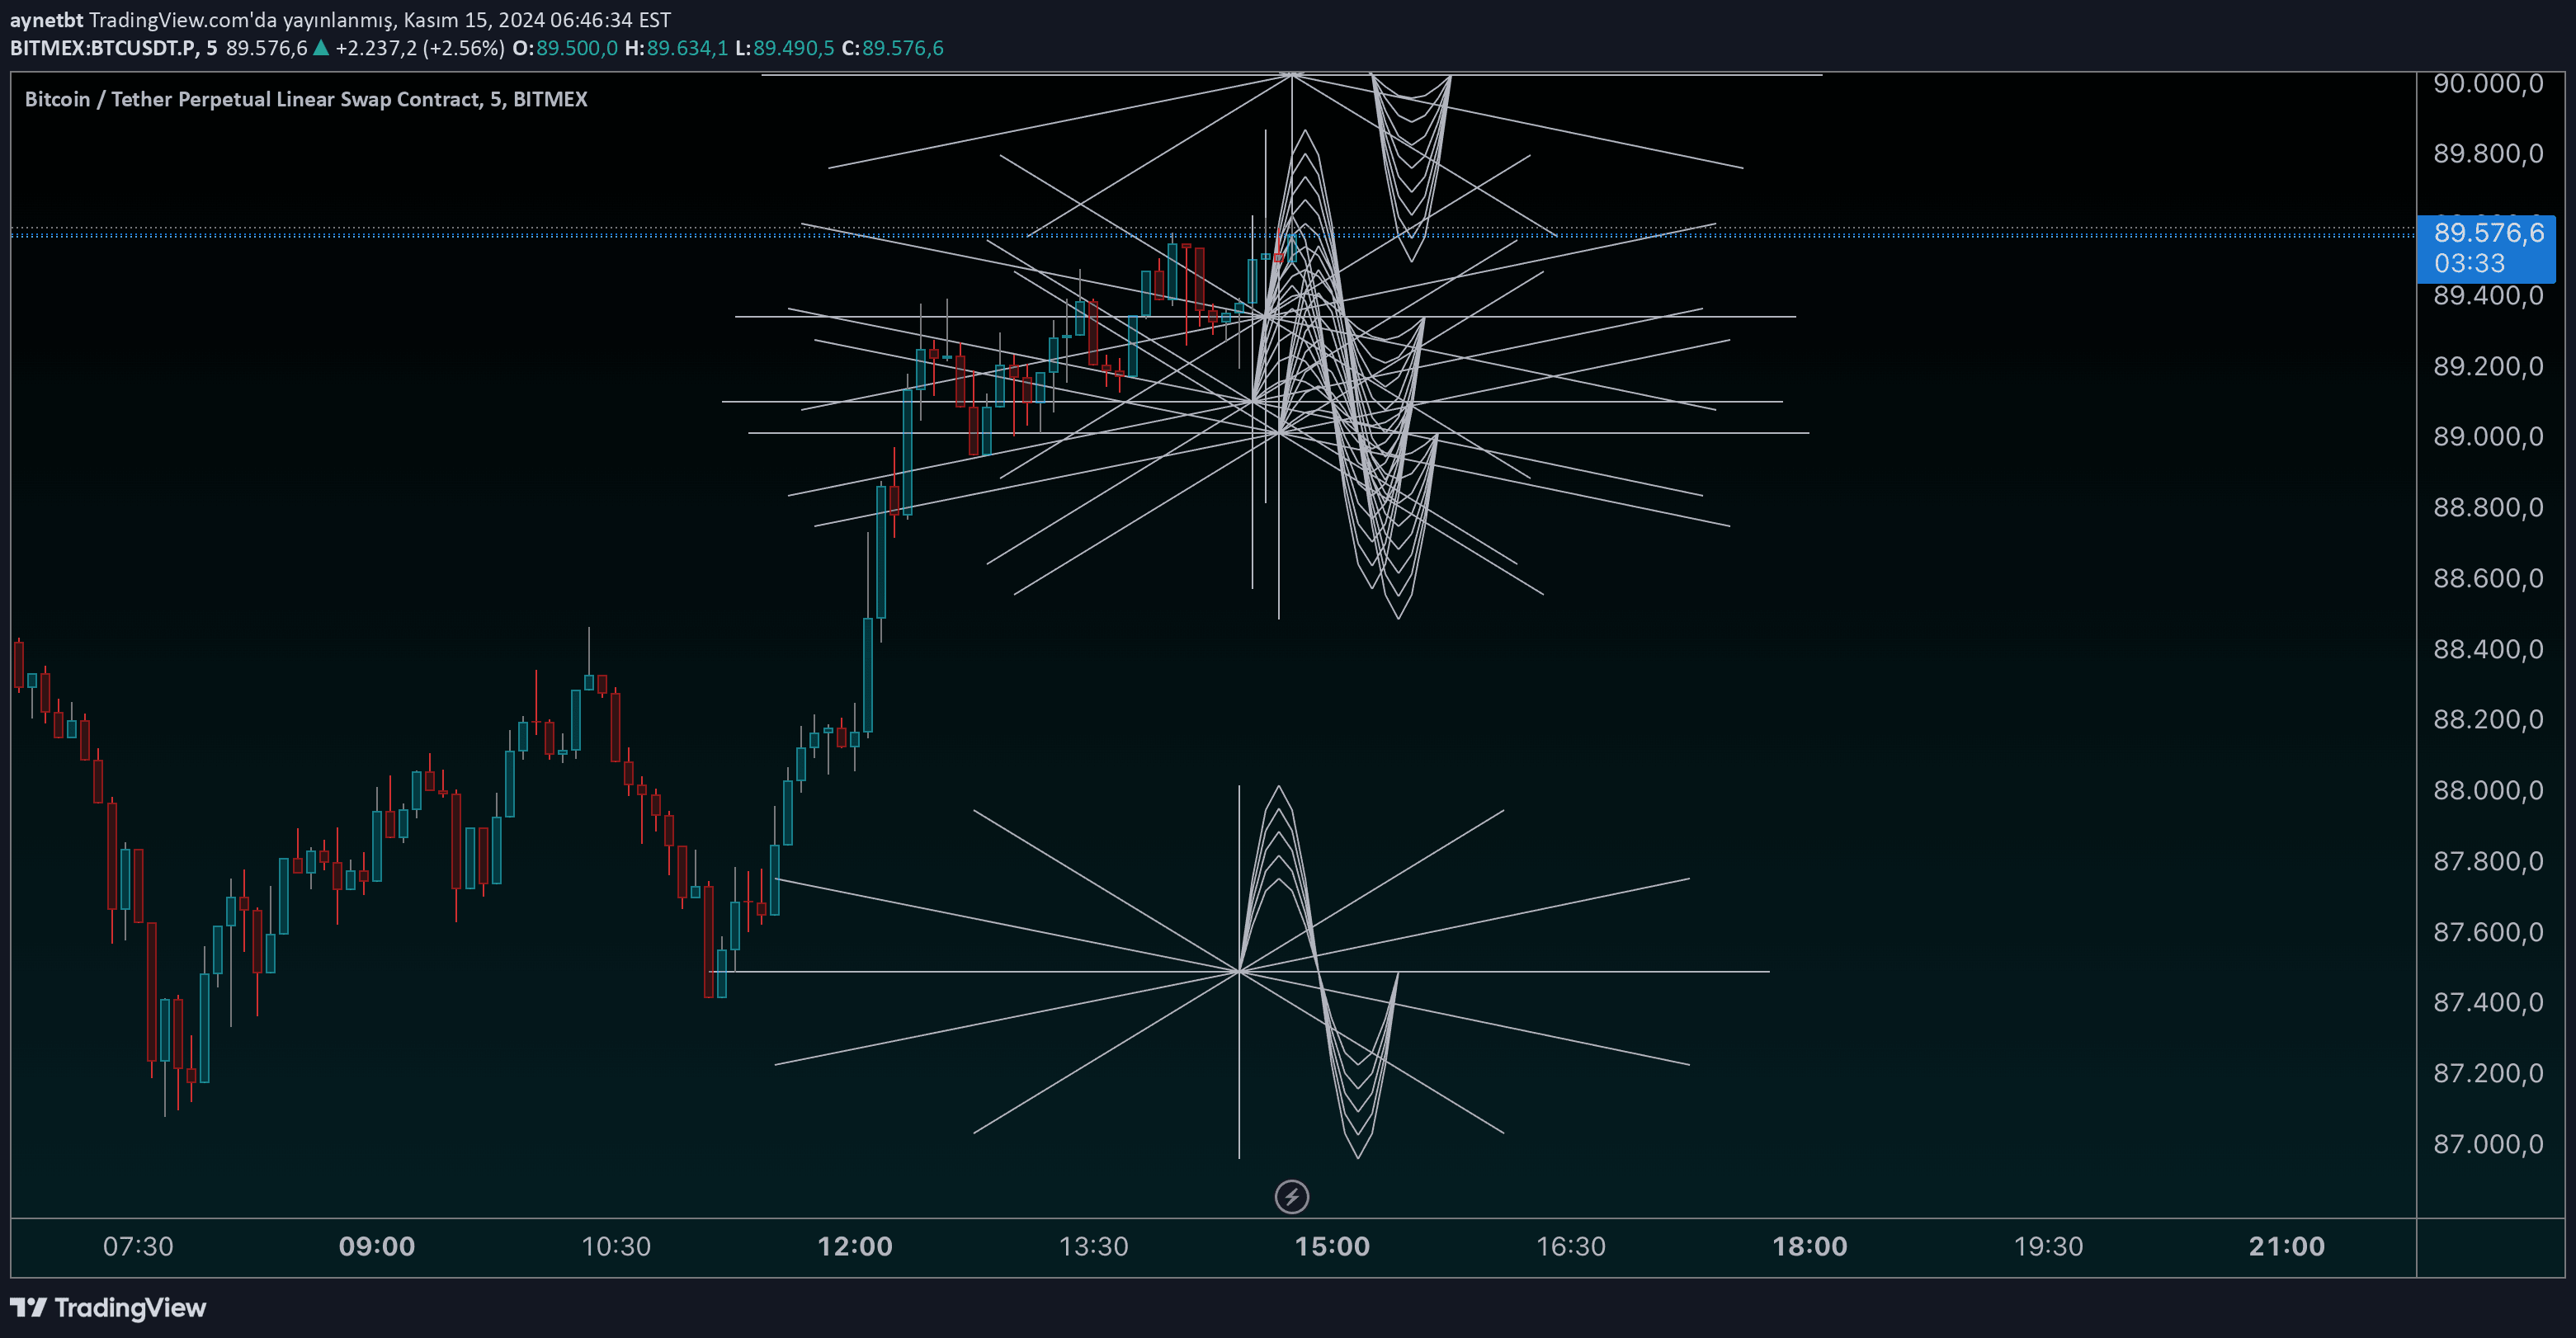
A visual trading tool creating a Mandala-like chart pattern with concentric rings and symmetry lines, offering a unique perspective on market dynamics and price visualization.
Explore complementary indicator rolesHow it works
The Mandala chart is constructed using dynamic parameters that create a visual representation of market data. It generates concentric rings centered around the current price, with multiple radial symmetry lines emanating from the center point.
Traders can customize the visualization by adjusting the number of rings, spacing between rings, and number of symmetry lines. The center point is typically set to the closing price, but can be modified to a fixed level, allowing for flexible market analysis and pattern recognition.
Why it may be useful
The Mandala chart provides traders with a unique visual framework for understanding market dynamics and price movements. By transforming raw price data into a geometric pattern, it offers an alternative perspective that can reveal hidden market insights and potential trading opportunities.
This innovative visualization technique helps traders identify complex market patterns that might be difficult to recognize using traditional charting methods. The customizable nature of the Mandala chart allows for personalized analysis across different trading styles and market conditions.
When to explore it
The Mandala chart is most effective during periods of market consolidation or when seeking alternative visual analysis techniques. It works particularly well for traders who appreciate visual pattern recognition and want to explore market dynamics from a different perspective.
Traders should consider using this tool when traditional technical indicators fail to provide clear insights, or when they want to complement existing analysis methods. It is especially useful for visual learners and those interested in exploring innovative market visualization techniques.
Keep exploring
What we’ve verified
Access, alerts and repainting behaviour have not been independently verified for this indicator. Check the creator’s current publication and settings.
General descriptions and classifications are recovered research. Verified details above identify the specific checks we have completed. Check the creator’s current publication for later changes.


