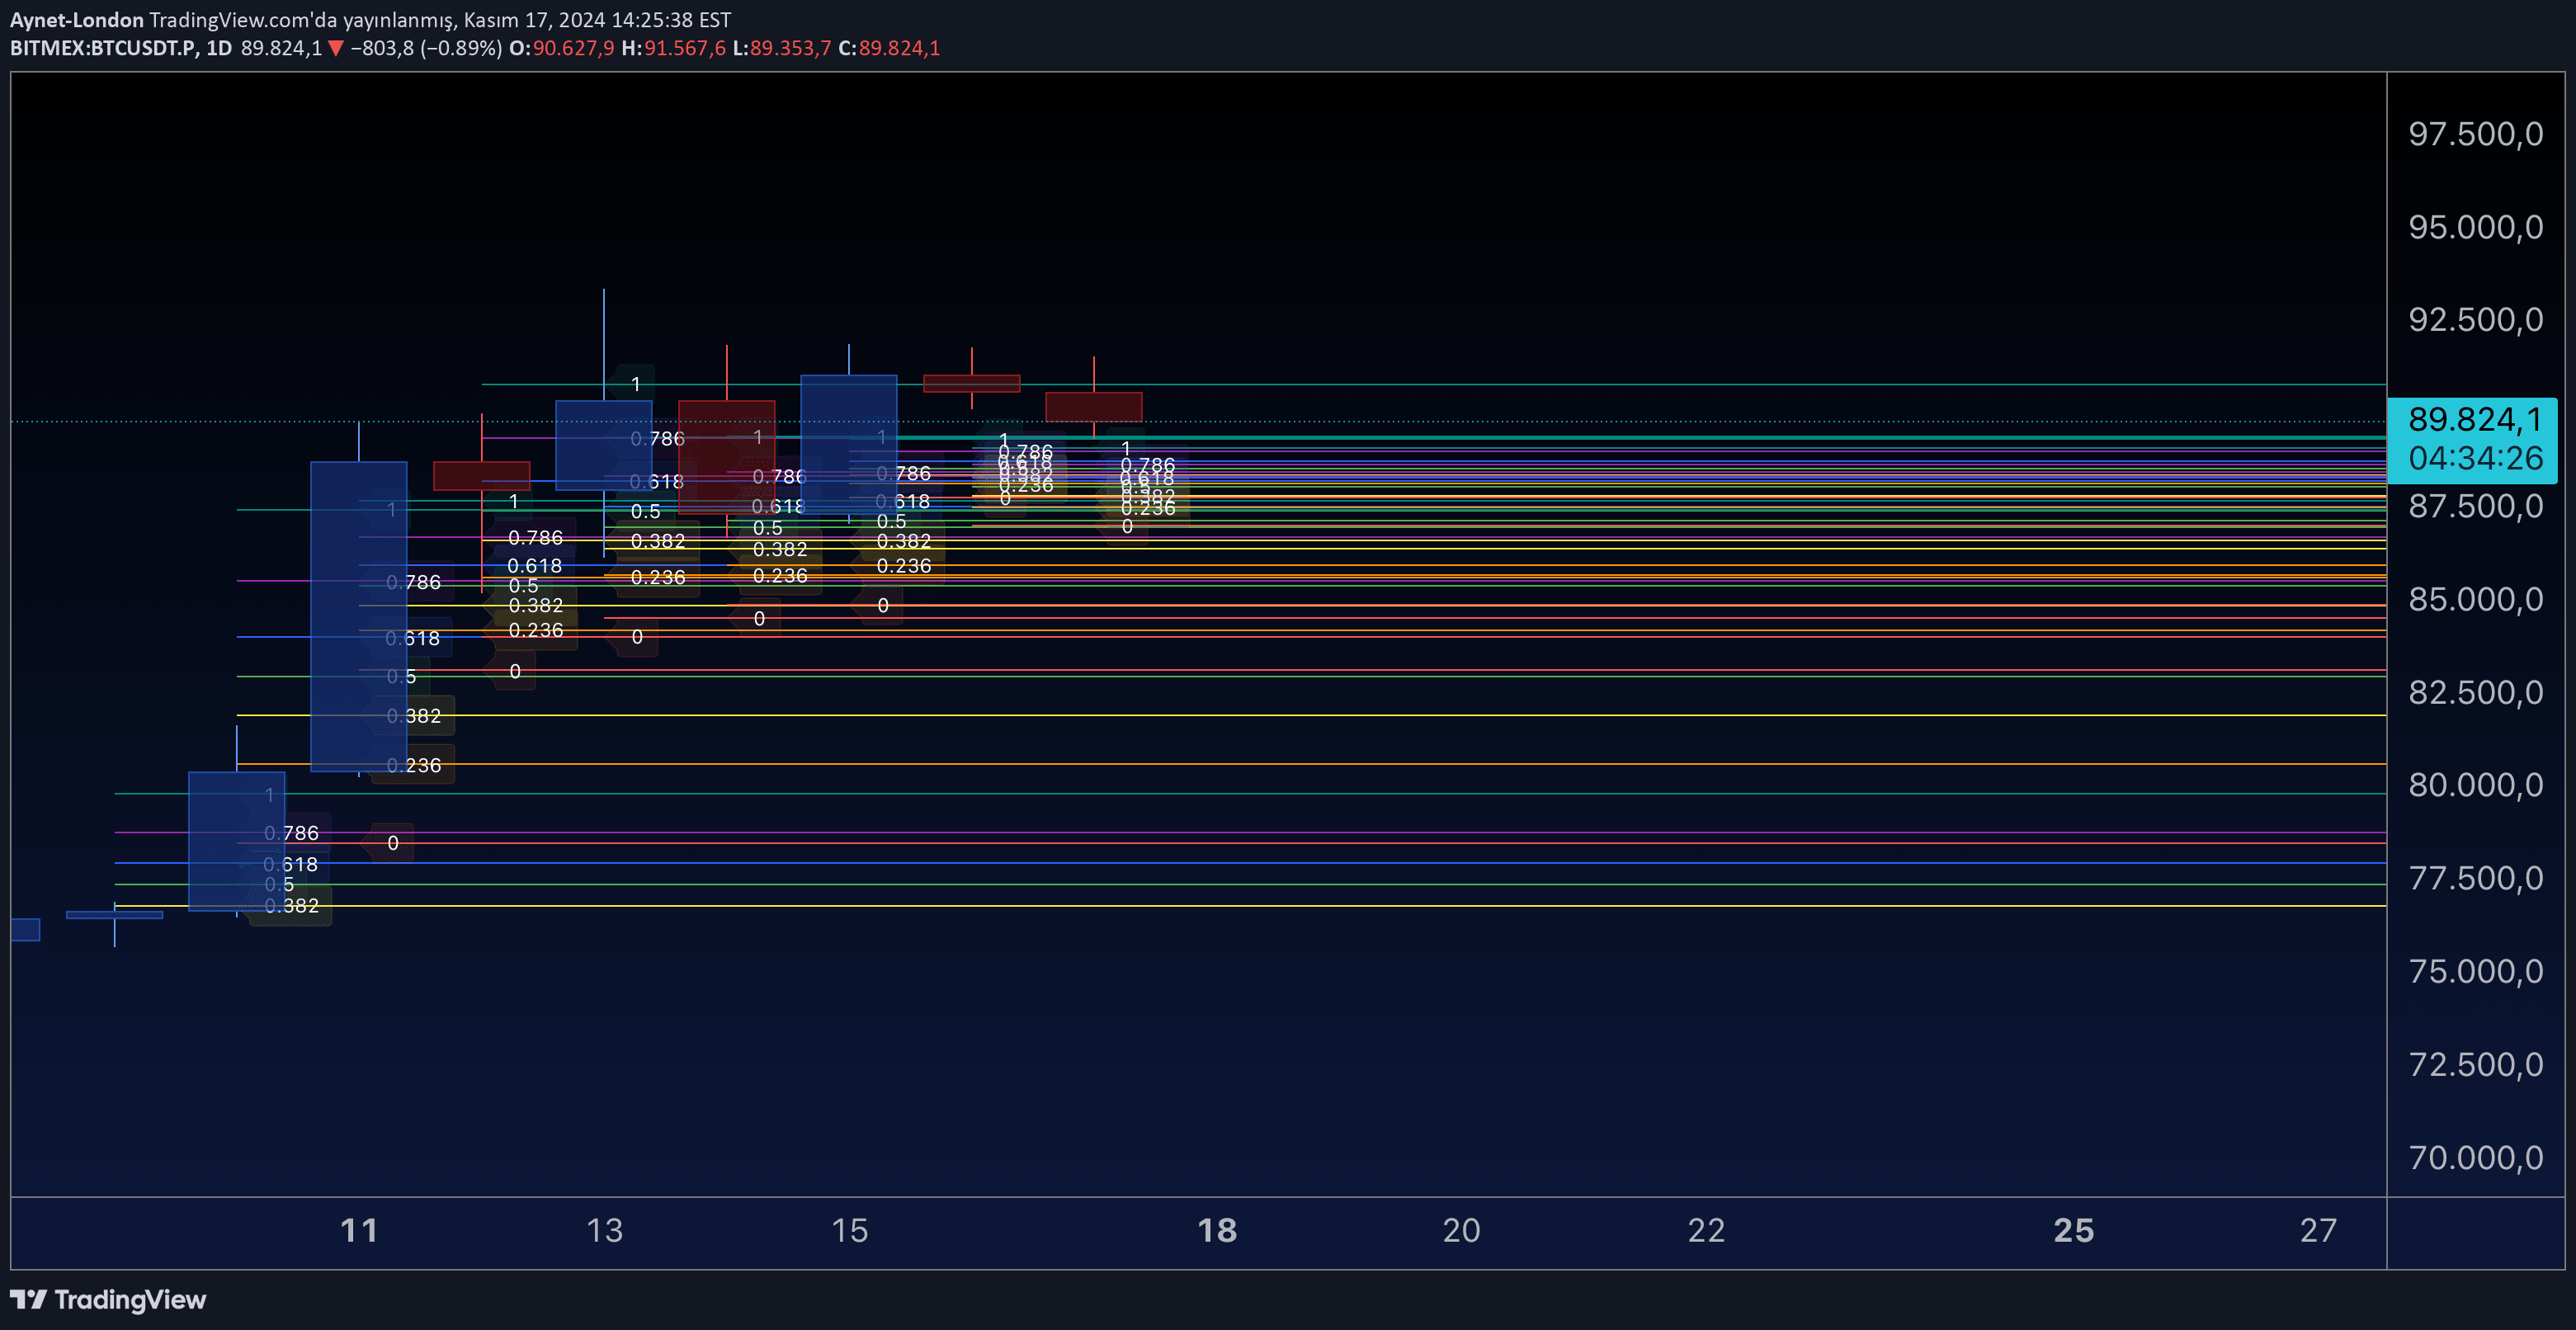
A geometric visualization technique using intersecting circles to create a Vesica Piscis pattern, offering unique insights into chart analysis and potential trading zones.
Explore complementary indicator rolesHow it works
The Vesica Piscis pattern is created by positioning two circles with centers that intersect each other's circumference, creating a distinctive geometric shape. By adjusting parameters like circle radius, line color, and number of segments, traders can customize the visualization to suit their specific chart analysis needs.
The technique involves precise placement of circles, typically offset horizontally to ensure their centers intersect. Traders can modify the smoothness of the circles by increasing or decreasing the segments, which determines the number of points used to create each circle's curve.
Why it may be useful
The Vesica Piscis pattern provides a unique visual approach to identifying potential trading zones and market intersections. By creating a geometric overlay on price charts, traders can gain additional perspective on market dynamics and potential trend interactions that might not be immediately apparent.
This visualization technique allows for creative chart analysis, enabling traders to explore market patterns from a different geometric perspective. The customizable nature of the circles and intersection areas provides flexibility in interpreting market movements and identifying potential entry or exit points.
When to explore it
The Vesica Piscis pattern is most effective when traders want to explore unique visual representations of market interactions and potential trend zones. It works best on charts where clear geometric patterns can reveal underlying market structures and potential trading opportunities.
Traders should consider using this technique when seeking alternative methods of chart analysis that go beyond traditional technical indicators. It is particularly useful for visual learners who appreciate geometric approaches to understanding market dynamics and potential price interactions.
Keep exploring
What we’ve verified
Access, alerts and repainting behaviour have not been independently verified for this indicator. Check the creator’s current publication and settings.
General descriptions and classifications are recovered research. Verified details above identify the specific checks we have completed. Check the creator’s current publication for later changes.