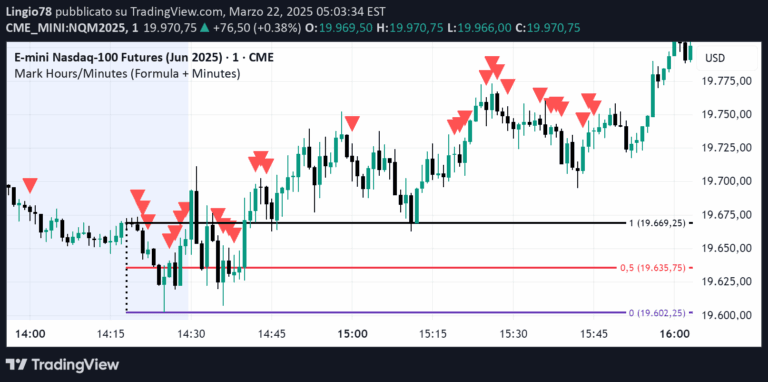
A dynamic support and resistance line tracking mechanism using maps to monitor price crossovers, automatically adjusting line properties and removing lines after maximum crosses.
Explore complementary indicator rolesHow it works
The signal identifies support and resistance lines using pivot high and low points in price action. It utilizes map collections to track the number of times price crosses these lines, maintaining detailed metadata about each support/resistance line's characteristics.
When price crosses a support line, the line is automatically transformed into a resistance line with changed color and style. The system tracks the number of crosses and adjusts line width accordingly, providing dynamic visual feedback about price interaction with key levels.
Why it may be useful
Support and resistance lines are crucial for understanding market structure and potential price reversal zones. This approach provides traders with a more flexible and adaptive method of tracking these critical price levels dynamically.
By automatically managing line properties and removing lines after multiple crosses, traders can maintain a clean and relevant chart that focuses on the most significant current market structures and potential trading opportunities.
When to explore it
This signal works best in markets with clear directional movements and identifiable support and resistance zones. It is particularly effective for traders looking to quickly adapt to changing market conditions and track price momentum.
The technique is most suitable for shorter timeframes like scalping and day trading, where rapid price action and frequent level interactions are more common. Traders can customize the maximum number of crosses to suit their specific trading strategy and market conditions.
Keep exploring
What we’ve verified
Access, alerts and repainting behaviour have not been independently verified for this indicator. Check the creator’s current publication and settings.
General descriptions and classifications are recovered research. Verified details above identify the specific checks we have completed. Check the creator’s current publication for later changes.