Pure Price Action ICT Tools [LuxAlgo]
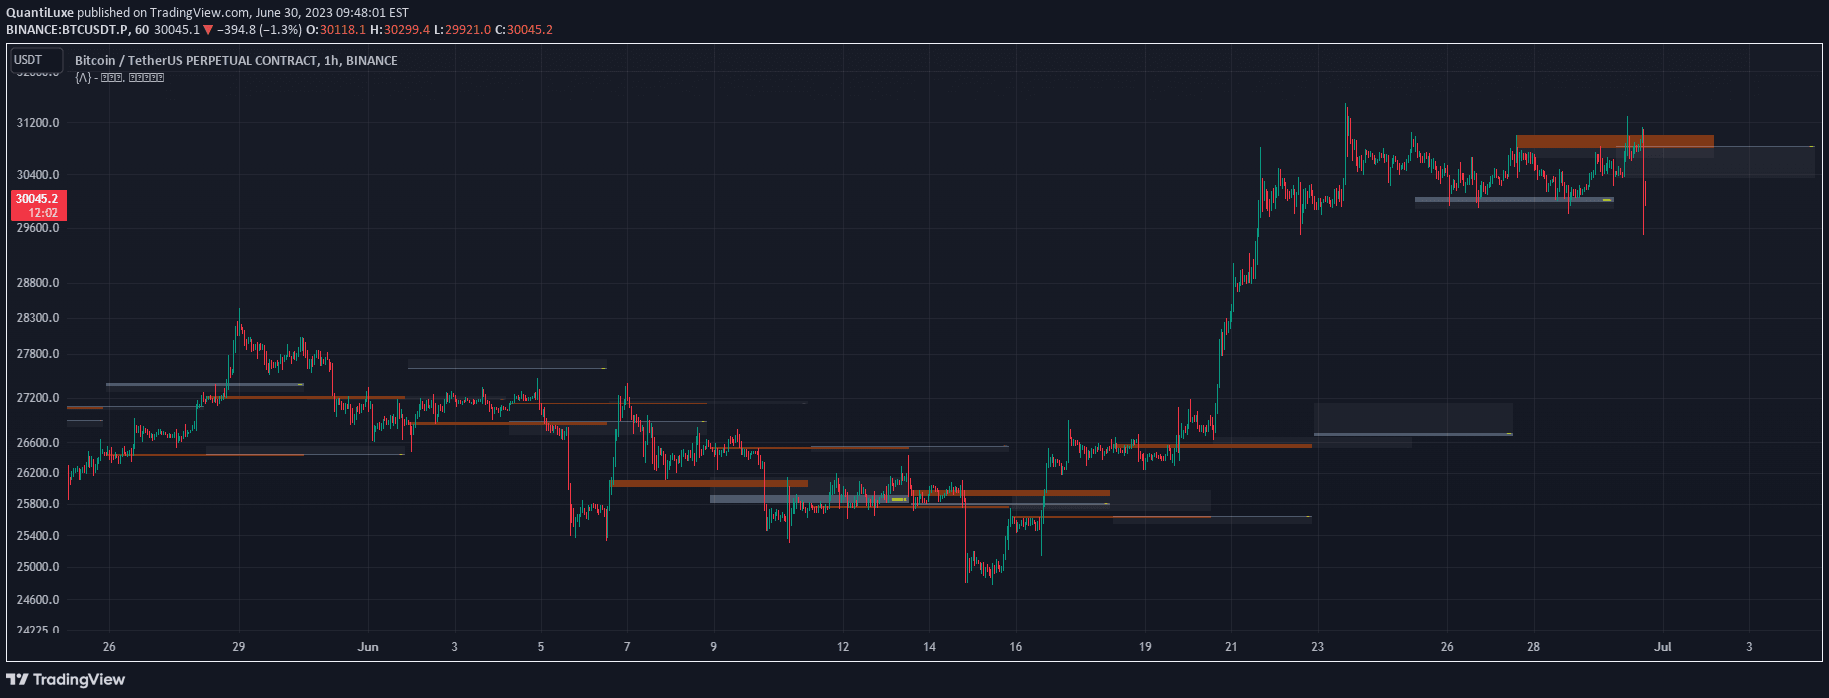
A comprehensive price action analysis tool that automatically identifies market structures, liquidity levels, order blocks, and potential trend shifts using pure price movement patterns.
Explore 11,183 indicators. Filter beyond the obvious.
Discover the tools that fit the way you trade.
11,183 tools to explore
A comprehensive price action analysis tool that automatically identifies market structures, liquidity levels, order blocks, and potential trend shifts using pure price movement patterns.
A volume heat map indicator that colors volume bars and candles based on the standard deviation of trading volume from its average. Provides visual insights into volume intensity and potential market significance.
Volume Profile is a trading indicator that maps trading volume across different price levels, revealing key market insights like Value Area, Point of Control, and session price ranges.
A probabilistic grid tool that visualizes potential price reversal locations using a 10x10 matrix, helping traders understand the likelihood of future market movements.
A dynamic trend-tracking indicator that identifies major trend shifts, maps price impulses, and quantifies trend strength through adaptive volatility envelopes and real-time percentage calculations.
Volume Profile maps trading volume across different price levels, highlighting areas of significant trading activity and potential support/resistance zones using advanced mapping techniques.
A liquidity analysis tool that identifies key price levels with significant trading volume, helping traders understand market depth and potential support/resistance zones.
A statistical tool that uses z-scores and scatterplot visualization to analyze price momentum, detect trend shifts, and provide insights into market dynamics.
A multi-timeframe trend detection tool using VIDYA moving averages that adapts to volume momentum, providing visual trend analysis across five customizable timeframes.
A volume-based indicator that identifies key supply and demand zones by analyzing volume profile and highlighting significant market interest areas across different price levels.
Theta Shield is an options trading indicator that uses stochastic oscillation to predict market sideways phases and help traders avoid potential theta decay in option positions.
The Daily Standard Deviation indicator maps price movements using statistical analysis, revealing typical price ranges and potential reversal points by measuring price dispersion around a mean.
Likes, views, and comments are historical TradingView snapshots. They describe attention, not trading performance.