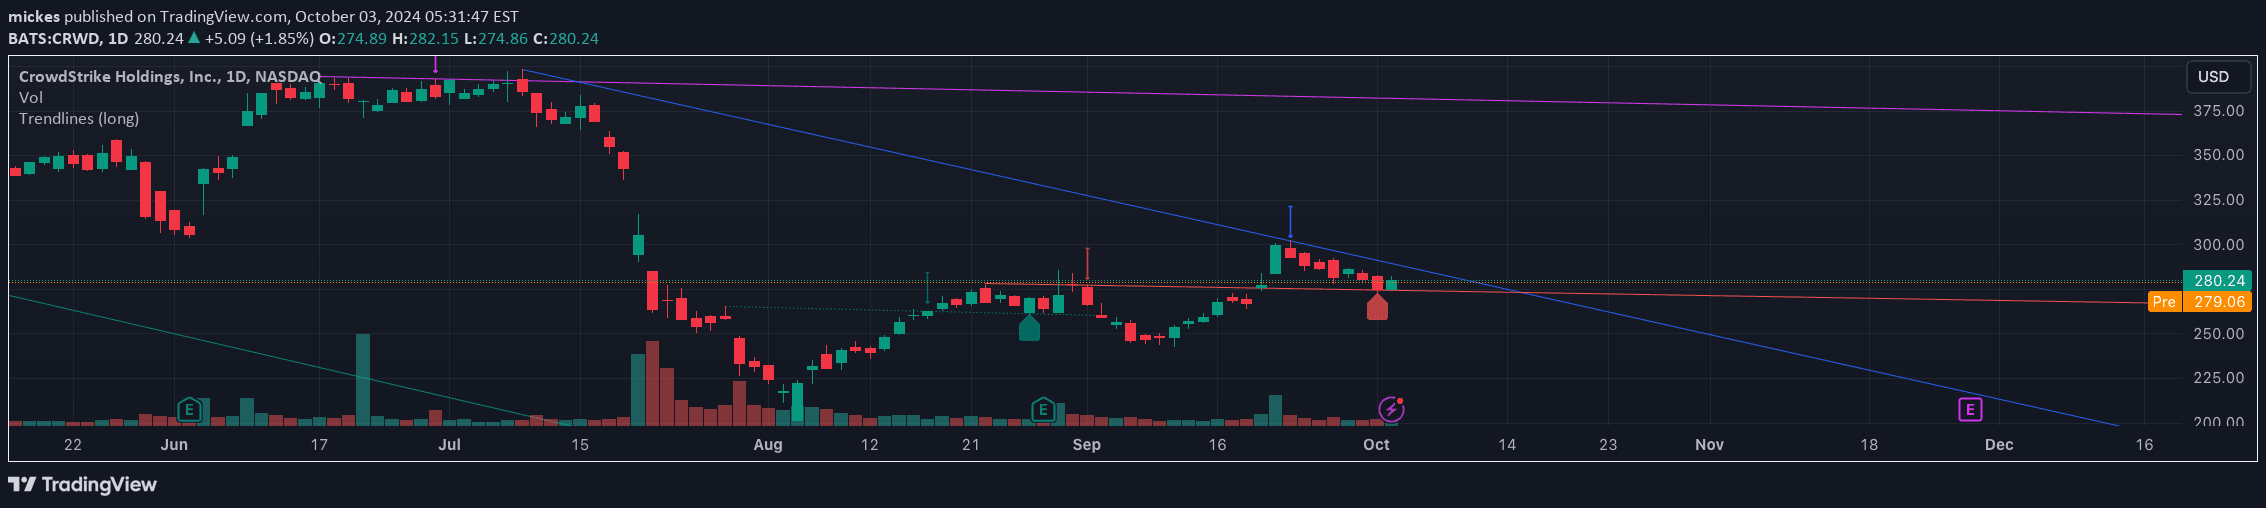
A real-time market analysis tool that detects trend shifts, draws support/resistance zones, and provides visual cues for trade confidence and potential market movements.
Explore complementary indicator rolesHow it works
The Market Map signal works by analyzing real-time price action and market structure using advanced algorithmic detection. It calculates trend direction based on 21/50 EMA crossovers, generating background color shading to indicate bullish or bearish market states.
The system dynamically identifies support and resistance zones by tracking pivot highs and lows, creating non-repainting dashed lines that help traders visualize key price levels. It also incorporates volume confirmation and ATR (Average True Range) to validate breakouts and breakdowns, ensuring higher probability trade signals.
Why it may be useful
This signal provides traders with a comprehensive visual framework for understanding market dynamics, reducing subjective interpretation and enhancing decision-making precision. By offering real-time trend context, support/resistance zones, and confidence indicators, it helps traders quickly assess market conditions and potential trade opportunities.
The tool's multi-dimensional approach combines trend analysis, volume confirmation, and structural insights, enabling traders to make more informed and strategic trading decisions across different market environments.
When to explore it
The Market Map signal is most effective in trending markets with clear directional momentum, where price is moving consistently between support and resistance zones. It works best for traders seeking a holistic view of market structure and looking to confirm trade entries and exits with multiple technical indicators.
Traders should utilize this signal during periods of consistent price movement, avoiding choppy or highly unpredictable market conditions. It is particularly useful for identifying potential breakouts, reversals, and trend continuation scenarios across various financial instruments.
Keep exploring
What we’ve verified
Access, alerts and repainting behaviour have not been independently verified for this indicator. Check the creator’s current publication and settings.
General descriptions and classifications are recovered research. Verified details above identify the specific checks we have completed. Check the creator’s current publication for later changes.