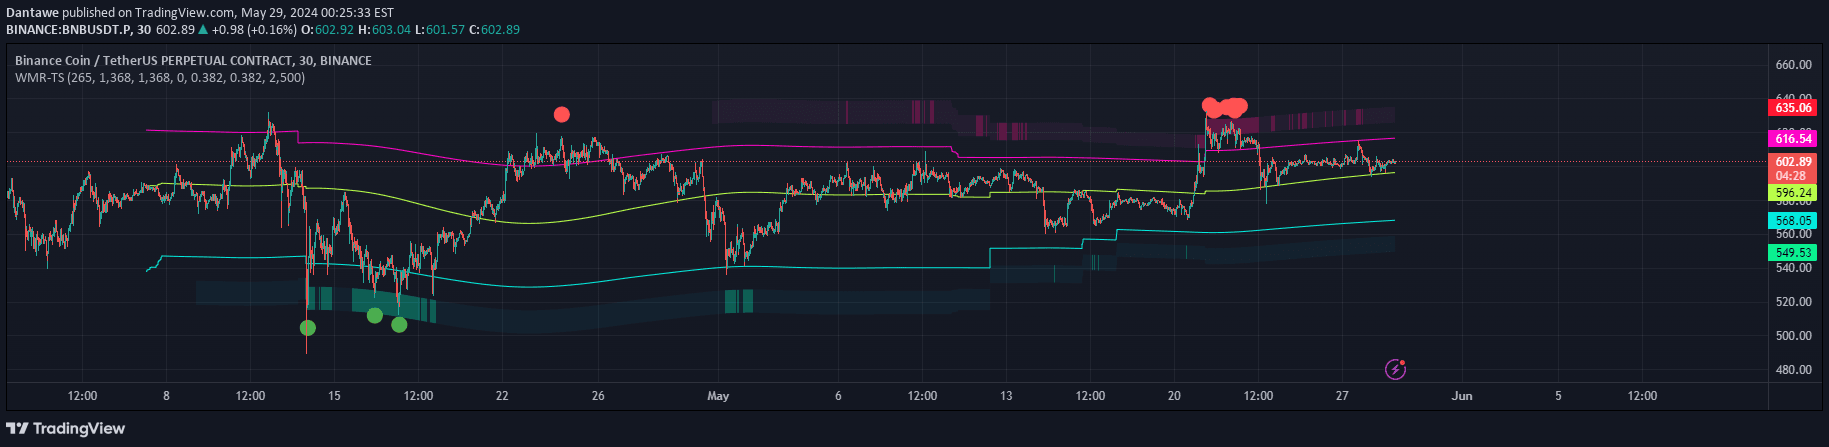
A multi-dimensional trading indicator that analyzes price dynamics through weighted moving averages, support/resistance levels, and trend identification markers to help traders spot potential market opportunities.
Explore complementary indicator rolesHow it works
The indicator combines multiple analytical techniques to assess market conditions by calculating support and resistance levels using price extremes over specified periods. It employs three weighted moving averages (WMAs) with different lengths, tracking their slopes and color-coding them to indicate trend direction.
The system generates visual signals through triangle markers for new highs and lows, and cross shapes when faster and slower WMAs intersect. It also calculates customizable pivot levels based on the range between support and resistance, providing traders with additional reference points for potential market movements.
Why it may be useful
By integrating multiple technical analysis components, this indicator offers traders a comprehensive view of market dynamics that goes beyond single-metric analysis. It provides nuanced insights into trend strength, potential reversals, and momentum shifts through its multi-layered approach to price action interpretation.
The combination of support/resistance levels, moving average analysis, and trend direction markers allows traders to make more informed decisions by understanding both current market conditions and potential future price movements.
When to explore it
This indicator is most effective in markets with clear trending characteristics, where price movements show consistent directional momentum. It works particularly well in liquid markets with sufficient price volatility, such as major forex pairs, stock indices, and actively traded commodities.
Traders should apply this indicator across multiple timeframes, from short-term scalping to longer-term swing trading, adjusting its parameters to match their specific trading strategy and risk tolerance. Backtesting and careful parameter optimization are recommended to maximize its effectiveness.
Keep exploring
What we’ve verified
Access, alerts and repainting behaviour have not been independently verified for this indicator. Check the creator’s current publication and settings.
General descriptions and classifications are recovered research. Verified details above identify the specific checks we have completed. Check the creator’s current publication for later changes.