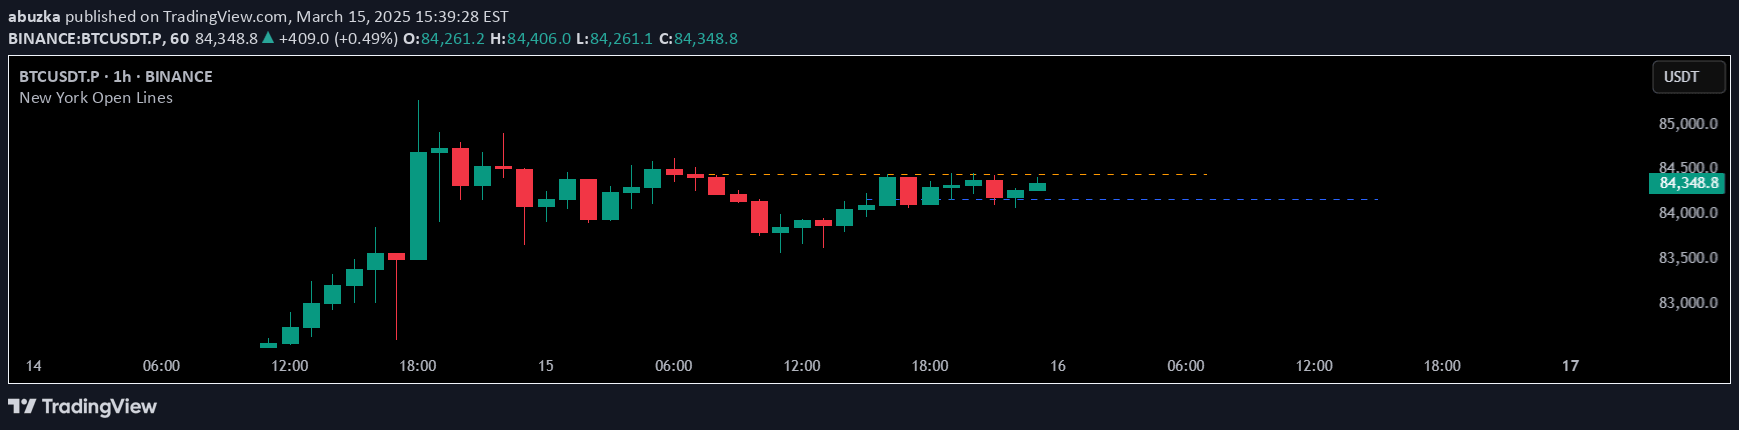
A trading indicator that identifies key price levels like pivots, supports, and resistances using higher timeframe analysis. Helps traders visualize crucial market turning points and potential price reactions.
Explore complementary indicator rolesHow it works
The ReadyFor401ks Pivot / Support / Resist indicator calculates critical price levels by analyzing a higher timeframe selected by the user. It determines a central pivot point (P) along with three resistance (R1, R2, R3) and support (S1, S2, S3) levels based on the chosen timeframe frequency.
These levels are dynamically recalculated to provide traders with a comprehensive view of potential market turning points. By examining price movements in relation to these predefined levels, traders can identify potential reversal zones, breakout opportunities, and areas of potential market consolidation.
Why it may be useful
This indicator provides traders with a structured approach to understanding market dynamics by revealing key price levels derived from longer-term data. It offers a broader context for price action, helping traders make more informed decisions about potential market movements and entry/exit points.
By highlighting pivot, support, and resistance levels, the indicator helps traders reduce emotional decision-making and provides a more objective framework for analyzing market behavior. The customizable nature of the tool allows traders to adapt it to different trading styles and timeframes, making it a versatile tool for technical analysis.
When to explore it
The ReadyFor401ks Pivot / Support / Resist indicator is most effective when used in markets with clear trending or ranging characteristics. It works particularly well for traders seeking to identify potential reversal points or confirm existing market trends across different timeframes.
Traders should consider using this indicator when analyzing daily or weekly charts, especially when looking to capture longer-term market movements. It is particularly useful for swing traders and investors who want to supplement their technical analysis with additional context about potential support and resistance levels.
Keep exploring
What we’ve verified
Access, alerts and repainting behaviour have not been independently verified for this indicator. Check the creator’s current publication and settings.
General descriptions and classifications are recovered research. Verified details above identify the specific checks we have completed. Check the creator’s current publication for later changes.