A dynamic market structure indicator that plots midpoints of recent candles, creating visual support and resistance levels across different timeframes.
Explore complementary indicator rolesHow it works
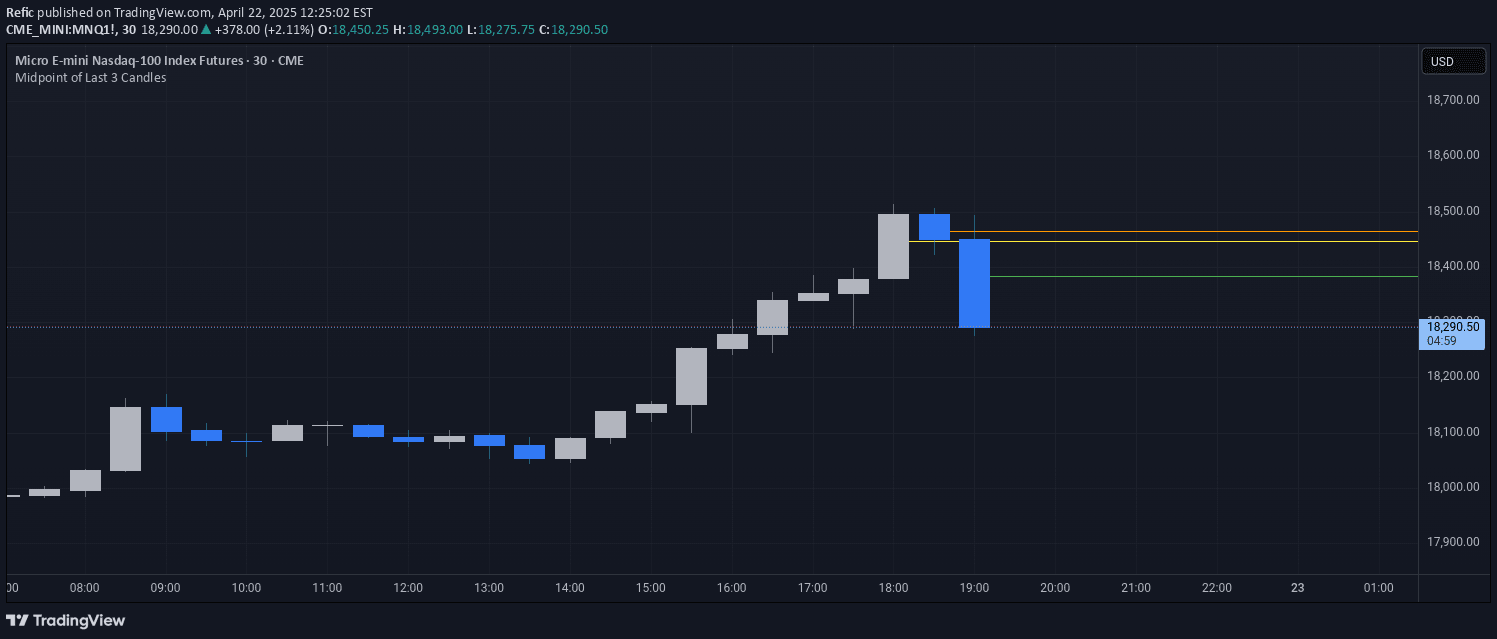
The indicator calculates the midpoint of each candle by averaging its high and low prices, creating horizontal lines for the current and previous two candles. These midpoint lines are plotted across the chart, extending into future price action with distinct color coding: green for the current candle, orange for the previous candle, and yellow for the candle before that.
By tracking these dynamic levels, traders can quickly visualize short-term price balance points and potential areas of market interaction. The lines serve as floating support and resistance zones that adjust in real-time with evolving price action, providing a flexible and adaptive framework for analyzing market structure.
Why it may be useful
This indicator offers traders a simple yet powerful visual tool for understanding short-term market dynamics and potential price reaction zones. By highlighting midpoint levels, it provides an intuitive way to identify areas where price might find support, resistance, or experience potential trend continuation or reversal.
The color-coded presentation allows for quick visual interpretation, helping traders rapidly assess market structure without complex calculations. Its adaptability across different timeframes and trading styles makes it a versatile tool for traders seeking to understand price behavior and potential strategic entry or exit points.
When to explore it
The midpoint market structure indicator is most effective in markets with clear short-term price movements and relatively consistent volatility. It works particularly well in liquid markets like forex, major stock indices, and actively traded commodities where price tends to respect recent structural levels.
Traders should consider using this indicator during periods of active trading, such as during market opening hours or when significant economic news might drive price action. It is especially useful for scalpers and day traders who need rapid, visually intuitive insights into potential price interaction zones.
Keep exploring
What we’ve verified
Access, alerts and repainting behaviour have not been independently verified for this indicator. Check the creator’s current publication and settings.
General descriptions and classifications are recovered research. Verified details above identify the specific checks we have completed. Check the creator’s current publication for later changes.