
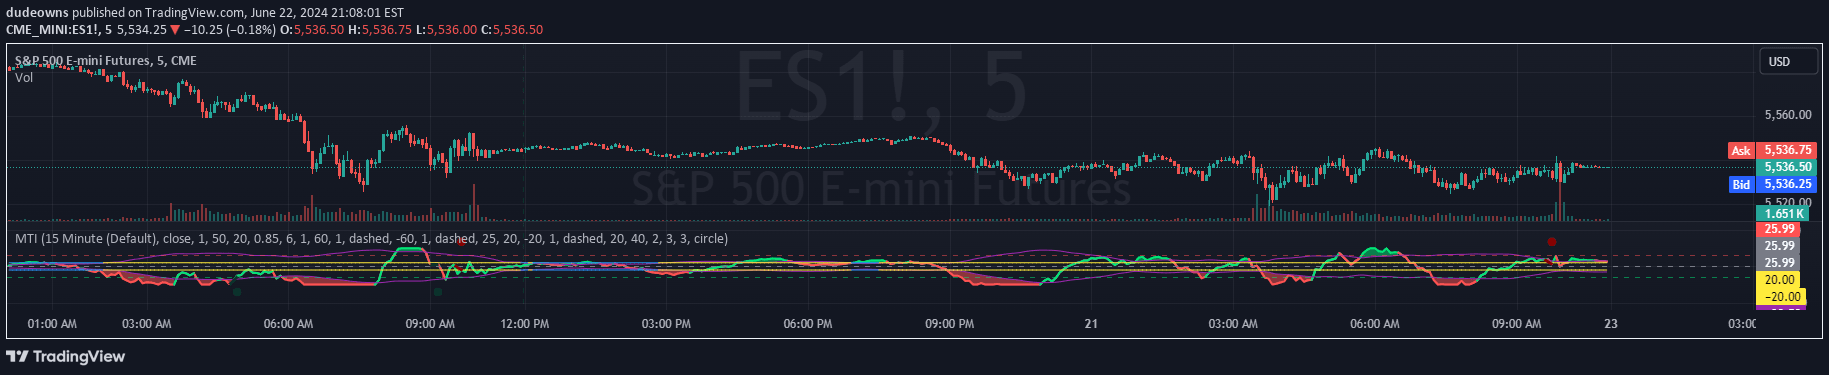
A sophisticated technical analysis tool using Arnaud Legoux Moving Average to identify market trends, smooth price data, and provide dynamic trend insights with visual enhancements.
Explore complementary indicator rolesHow it works
The Modern Trend Identifier (MTI) uses the Arnaud Legoux Moving Average (ALMA) to smooth price data and calculate percentage changes, reducing market noise and providing clearer trend analysis. It dynamically normalizes ALMA percentage change values within a -100 to 100 range, applying linear and smoothstep compression to handle extreme values without losing sensitivity.
The indicator determines trend direction by comparing the smoothed ALMA percentage change against dynamically calculated Root Mean Square (RMS) bands. It uses percentile ranks to adapt thresholds to changing market conditions, enabling responsive and accurate trend identification across different market environments.
Why it may be useful
MTI provides traders with a powerful, adaptive tool for understanding market momentum and trend dynamics, offering visual cues that enhance decision-making and strategic planning. By smoothing price data and calculating percentage changes, it helps traders cut through market noise and focus on meaningful trend information.
The indicator's dynamic threshold calculation and comprehensive visualization features allow traders to quickly assess trend strength, potential reversals, and momentum shifts. Its ability to work across multiple timeframes makes it versatile for different trading styles, helping traders make more informed and data-driven investment decisions.
When to explore it
MTI is most effective in markets with clear trending characteristics, where price movements are more directional and less choppy. It performs exceptionally well in liquid markets like forex, major stock indices, and high-volume commodities where trend signals are more reliable and pronounced.
Traders should leverage MTI during periods of sustained market movement, such as during strong bullish or bearish trends, economic announcements, and when trading instruments with consistent volatility. It is particularly useful for traders seeking to identify early trend changes, confirm existing trends, and develop systematic entry and exit strategies across various timeframes.
Keep exploring
What we’ve verified
Access, alerts and repainting behaviour have not been independently verified for this indicator. Check the creator’s current publication and settings.
General descriptions and classifications are recovered research. Verified details above identify the specific checks we have completed. Check the creator’s current publication for later changes.


