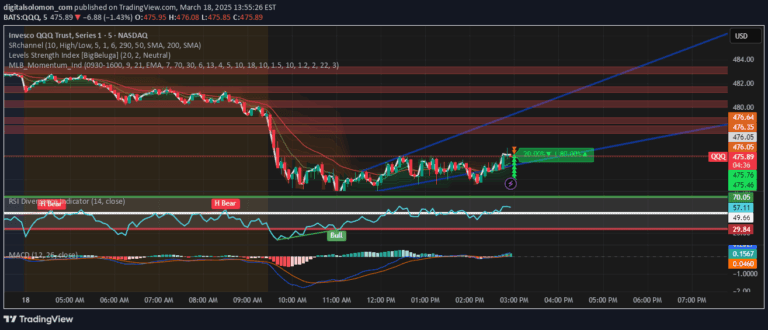
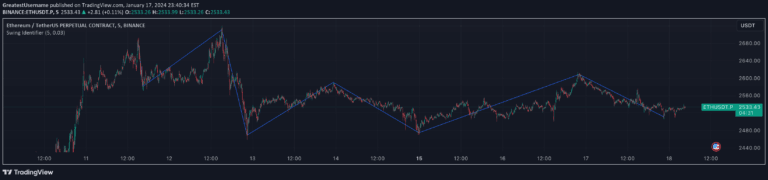
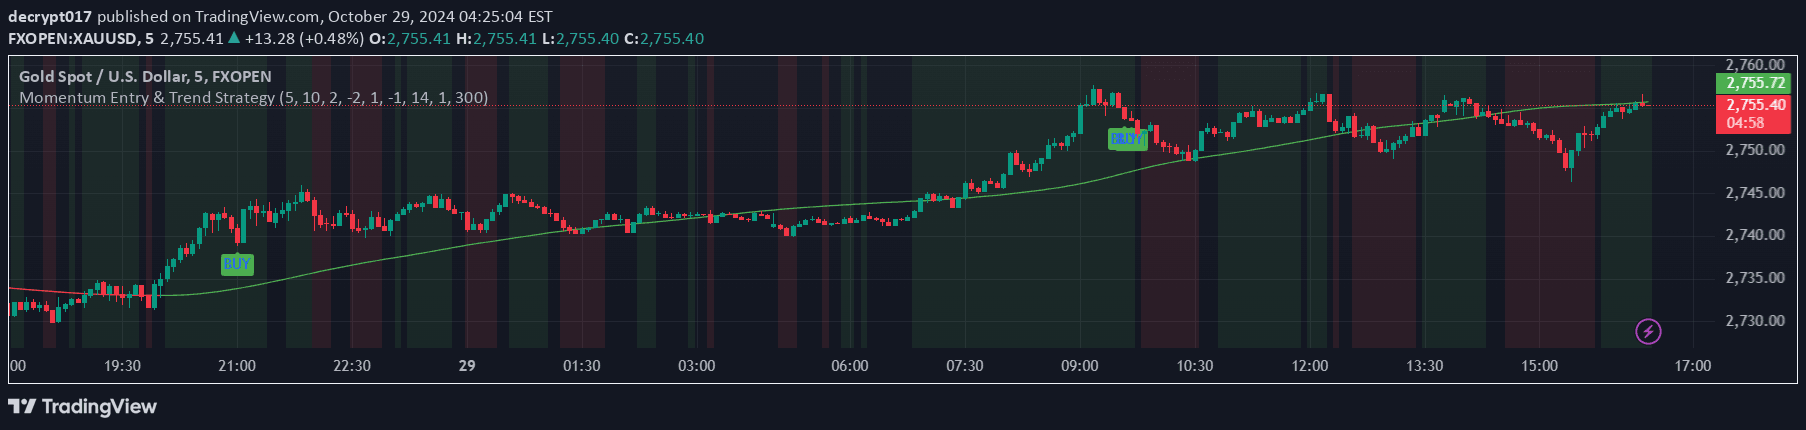
An advanced breakout indicator that identifies decisive price movements beyond a predefined range using a single engulfing candle, providing clear visual signals for potential trend changes.
Explore complementary indicator rolesHow it works
The indicator first analyzes a specified number of previous candles to establish a lateral trading range, identifying the highest and lowest price points during that period. When a single engulfing candle decisively breaks through this range, either above or below, the indicator triggers a breakout signal, highlighting the broken range with a visual rectangle.
Traders can customize the breakout detection method, choosing between full candle or body-only breakout criteria. The indicator then plots directional arrows to show the breakout direction, making it easy to identify potential trend transitions and emerging momentum in the price movement.
Why it may be useful
Breakout signals are crucial for traders seeking to capitalize on significant market movements that indicate potential trend reversals or continuations. By identifying clean, decisive breakouts, traders can gain early insight into emerging price trends and make more informed trading decisions with reduced false signal risk.
The visual representation of the broken range and clear directional arrows help traders quickly assess market dynamics, reducing the cognitive load of manual chart analysis. This approach provides a systematic method for recognizing potential trading opportunities across different timeframes and market conditions.
When to explore it
This breakout indicator is most effective during periods of market consolidation or ranging markets, where prices have been trading within a tight horizontal range. Traders can use it to identify potential trend initiation points, capturing the moment when price breaks out of its previous congestion zone with significant momentum.
The indicator is particularly useful in volatile markets with clear support and resistance levels, such as forex, stocks, and cryptocurrency trading. It works best when combined with other technical analysis tools to confirm the breakout's validity and assess the potential strength of the emerging trend.
Keep exploring
What we’ve verified
Access, alerts and repainting behaviour have not been independently verified for this indicator. Check the creator’s current publication and settings.
General descriptions and classifications are recovered research. Verified details above identify the specific checks we have completed. Check the creator’s current publication for later changes.