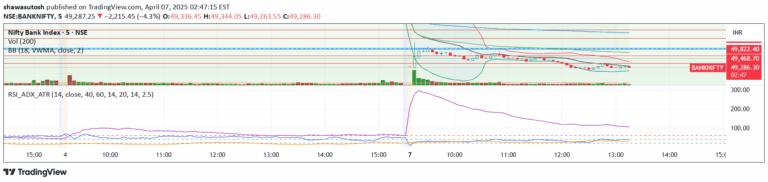
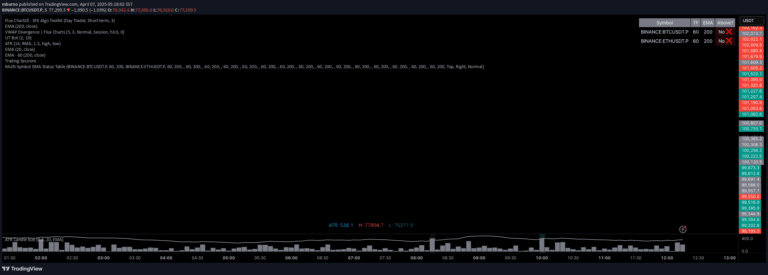
A custom EMA-MACD indicator designed to identify trend direction, momentum shifts, and potential trading signals using multiple EMA lengths and MACD calculations.
Explore complementary indicator rolesHow it works
The Moneyball EMA-MACD Indicator operates by calculating multiple exponential moving averages (3, 9, 20, and 50 EMA) to track short and long-term price trends. It generates a custom MACD using specific length parameters and a smoothing period, which allows traders to analyze price momentum and potential trend reversals.
The indicator compares the MACD line against its signal line and zero line, creating color-coded bar signals that represent different market conditions. By tracking crossovers and relative positioning of these lines, traders can identify potential entry and exit points across different timeframes.
Why it may be useful
This indicator helps traders make more informed decisions by providing a comprehensive view of market momentum and trend direction through its multi-layered analysis. By combining EMA and MACD calculations, it offers insights into potential trend shifts that might be missed by using a single indicator.
The color-coded bar system simplifies complex technical analysis, allowing traders to quickly understand market conditions. Its flexibility in customization and adaptability across different timeframes make it a versatile tool for traders seeking to capture both small consistent gains and larger trend movements.
When to explore it
The Moneyball EMA-MACD Indicator works best in markets with clear trending characteristics, where momentum can be reliably measured. It is particularly effective in identifying potential trend reversals and momentum shifts across various financial instruments and timeframes.
Traders should use this indicator in conjunction with other technical analysis tools to confirm signals and reduce false positives. It is especially useful for traders who prefer a systematic approach to identifying trading opportunities, with a focus on capturing incremental gains and understanding underlying market dynamics.
Keep exploring
What we’ve verified
Access, alerts and repainting behaviour have not been independently verified for this indicator. Check the creator’s current publication and settings.
General descriptions and classifications are recovered research. Verified details above identify the specific checks we have completed. Check the creator’s current publication for later changes.