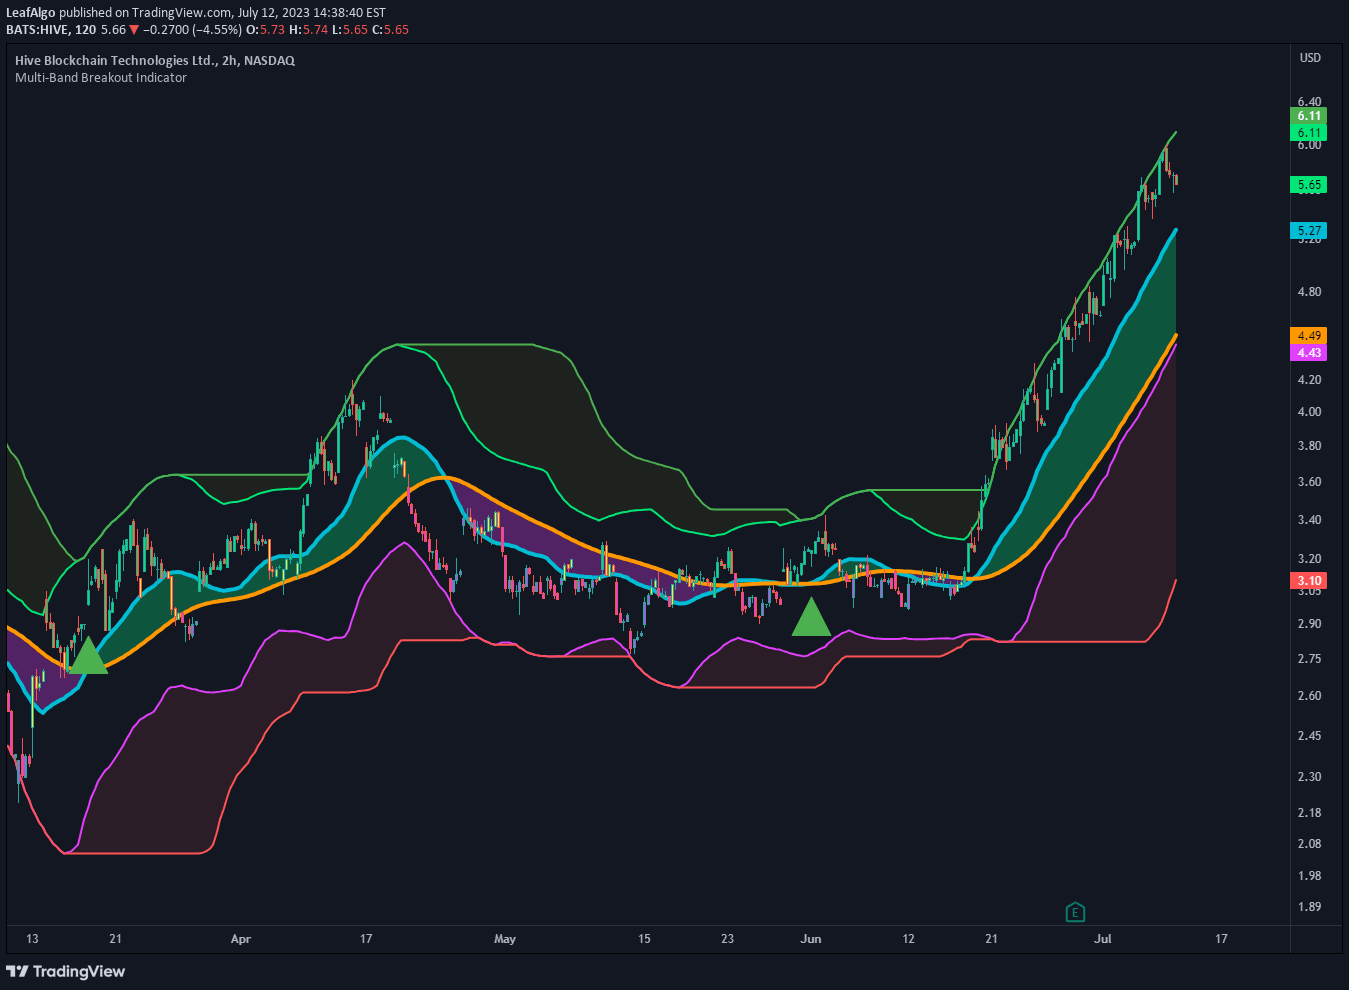
A predictive indicator for Bitcoin that identifies potential large price swings by analyzing price momentum and volatility through dynamic bands on the daily timeframe.
Explore complementary indicator rolesHow it works
The MoonFlag indicator creates dynamic bands around price action based on momentum, tracking the volatility and potential for significant price movements. When price action momentum stabilizes and volatility reduces, the bands begin to narrow, signaling a potential upcoming large price swing.
Unlike traditional moving averages that lag behind price action, this script uses real-time momentum calculations to predict potential breakouts. When the bands converge to a predetermined percentage, the background turns yellow, indicating a high probability of an imminent substantial price movement in either direction.
Why it may be useful
This indicator provides traders with a unique predictive tool that anticipates potential large price swings before they occur, offering a strategic advantage in market analysis. By focusing on momentum and volatility convergence, it helps traders identify periods of market consolidation that typically precede significant price movements.
The MoonFlag script is particularly valuable for Bitcoin trading, as it offers insights into potential trend changes and breakout opportunities. Its ability to lead price action, rather than lag behind it, makes it a powerful tool for traders seeking to make informed decisions based on early momentum signals.
When to explore it
The MoonFlag indicator is most effective when used on Bitcoin's daily timeframe, providing insights into potential large price swings over extended periods. Traders should focus on the yellow vertical lines and narrowing bands as signals of potential upcoming market movements, typically spanning days to weeks or even months.
It is best utilized by experienced traders who can interpret the signals in conjunction with other market analysis tools. Traders should wait for the yellow lines to appear, then carefully assess potential trade directions, understanding that the indicator suggests a swing is likely but does not predict its specific direction.
Keep exploring
What we’ve verified
Access, alerts and repainting behaviour have not been independently verified for this indicator. Check the creator’s current publication and settings.
General descriptions and classifications are recovered research. Verified details above identify the specific checks we have completed. Check the creator’s current publication for later changes.