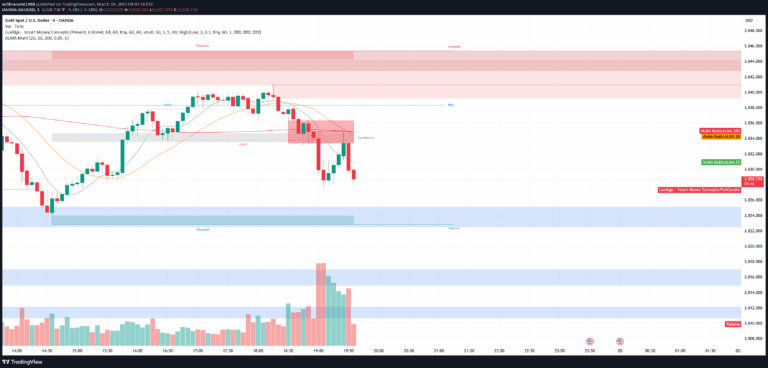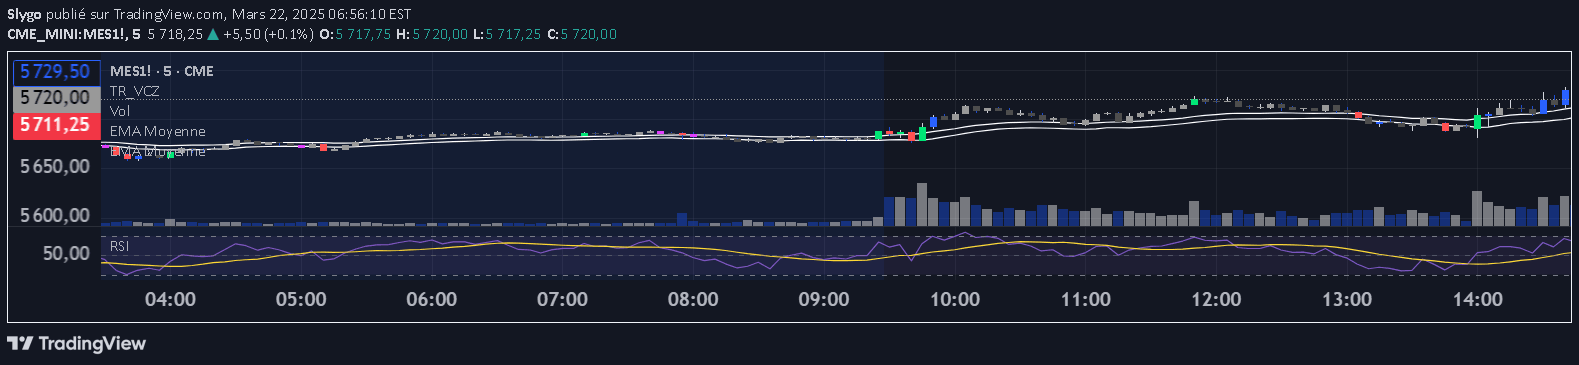
An EMA-based trading signal that calculates average movement across multiple timeframes using 5, 9, 20, 50, 100, and 200 period exponential moving averages on various price data points.
Explore complementary indicator rolesHow it works
The EMA trading signal computes an average of Exponential Moving Averages across six different periods: 5, 9, 20, 50, 100, and 200. By calculating these averages on high, low, opening, or closing prices, traders can identify complex trend dynamics. The multiple EMA periods provide a comprehensive view of short-term and long-term price movements.
Each EMA period represents a different market perspective, from rapid short-term fluctuations to broader trend trajectories. Traders analyze the interactions and convergences between these different EMA lines to understand potential trend strengths and directions. The signal helps smooth out price data, reducing market noise and highlighting underlying trend movements
Why it may be useful
This multi-period EMA signal offers traders a nuanced understanding of market trends by integrating multiple timeframe perspectives. By combining different EMA lengths, traders can detect subtle trend changes that might be missed by single-period indicators. The signal provides a more robust trend analysis by averaging across various price points and periods.
It helps traders identify potential trend reversals, confirm trend strengths, and make more informed trading decisions. The comprehensive approach reduces false signals and provides a more holistic market view. Traders can use this signal to develop more sophisticated entry and exit strategies across different market conditions
When to explore it
The multi-period EMA signal works best in trending markets with clear directional movements. It is particularly effective in liquid markets like forex, stocks, and major cryptocurrency pairs. Traders should apply this signal during periods of consistent price trends rather than highly choppy or range-bound markets.
The signal is most reliable when used in conjunction with other technical analysis tools and confirmation indicators. It performs well across daily, 4-hour, and 1-hour charts for swing and day trading strategies. Traders should be cautious during high-volatility events or fundamental market shifts that can disrupt trend patterns
Keep exploring
What we’ve verified
Access, alerts and repainting behaviour have not been independently verified for this indicator. Check the creator’s current publication and settings.
General descriptions and classifications are recovered research. Verified details above identify the specific checks we have completed. Check the creator’s current publication for later changes.