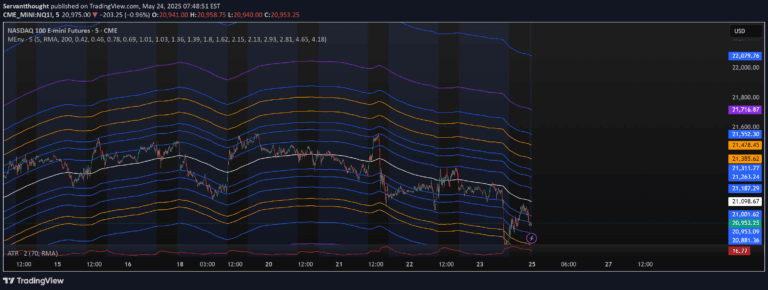
A multi-timeframe tunnel indicator using three exponential moving averages to identify trend dynamics, support/resistance zones, and potential trading opportunities across different market contexts.
Explore complementary indicator rolesHow it works
The MTF Tunnel Vegas indicator creates a dynamic trading channel by plotting three specific exponential moving averages: 144, 169, and 233-period EMAs. These moving averages form a tunnel that tracks price movements and establishes key reference zones on the chart.
The indicator overlays this tunnel from a higher timeframe onto the current chart, allowing traders to simultaneously view multiple timeframe perspectives. By analyzing how price interacts with these EMA levels - whether bouncing off, approaching, or breaking through - traders can gain insights into potential trend continuation or reversal scenarios.
Why it may be useful
The MTF Tunnel Vegas indicator provides traders with a comprehensive view of market dynamics by integrating multiple timeframe analysis into a single visual tool. It helps traders understand underlying trend structures and identify potential trading opportunities with greater context and clarity.
By reducing chart noise and offering a structured approach to trend analysis, this indicator enables traders to make more informed decisions. The tunnel's dynamic nature allows for adaptable interpretation across different market conditions, supporting more strategic entry and exit point selection.
When to explore it
The MTF Tunnel Vegas indicator works best in trending markets where price shows clear directional movement and respects moving average levels. Traders can utilize this tool most effectively when seeking to confirm trend strength, identify potential support and resistance zones, and align shorter-term trading decisions with larger market trends.
The indicator is particularly valuable during periods of sustained market momentum, where price consistently interacts with the EMA tunnel. Traders should pay special attention to moments when price approaches, bounces off, or breaks through these dynamic levels, as these interactions can signal significant potential trading opportunities.
Keep exploring
What we’ve verified
Access, alerts and repainting behaviour have not been independently verified for this indicator. Check the creator’s current publication and settings.
General descriptions and classifications are recovered research. Verified details above identify the specific checks we have completed. Check the creator’s current publication for later changes.