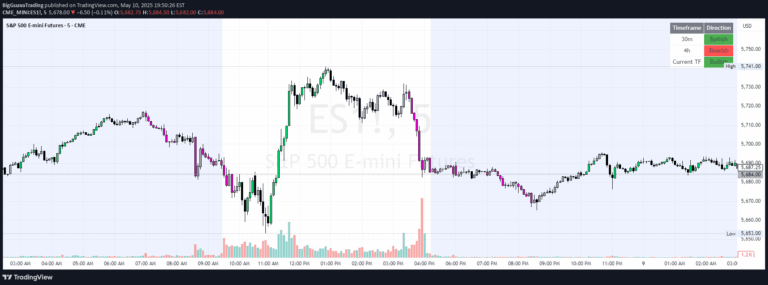
A multi-period relative strength indicator that compares an instrument's performance against peers, providing insights into short-term and long-term trend dynamics.
Explore complementary indicator rolesHow it works
The Multi Period Relative Strength Indicator operates by analyzing an instrument's performance across two distinct time periods: a fast period (one week) and a slow period (three months). It calculates relative strength by comparing the instrument's performance against its peers or a benchmark index within the same asset class.
The indicator generates visual representations through green and red elements, with green indicating strength and red indicating weakness. Positive values above zero represent relative strength, while values below zero suggest relative weakness, allowing traders to quickly interpret the instrument's performance dynamics.
Why it may be useful
The Multi Period Relative Strength Indicator provides traders with a nuanced perspective on market performance by simultaneously evaluating short-term and long-term trends. It helps traders identify underlying strength or weakness in an instrument, enabling more informed decision-making and strategic portfolio management.
By offering insights into relative performance across different time frames, the indicator allows traders to detect emerging trends, potential reversals, and divergences that might not be apparent through traditional price analysis. This comprehensive view supports more sophisticated risk management and trading strategy development.
When to explore it
The indicator is most effective when analyzing instruments within the same asset class or sector, where comparative performance can provide meaningful insights. It is particularly useful during market transitions, helping traders identify potential trend changes and relative strength shifts before they become widely recognized.
Traders should leverage this indicator when seeking to make strategic entry or exit decisions, assess portfolio composition, or evaluate the comparative performance of different instruments. It is especially valuable for swing traders and day traders looking to understand the underlying momentum and strength of their trading instruments.
Keep exploring
What we’ve verified
Access, alerts and repainting behaviour have not been independently verified for this indicator. Check the creator’s current publication and settings.
General descriptions and classifications are recovered research. Verified details above identify the specific checks we have completed. Check the creator’s current publication for later changes.