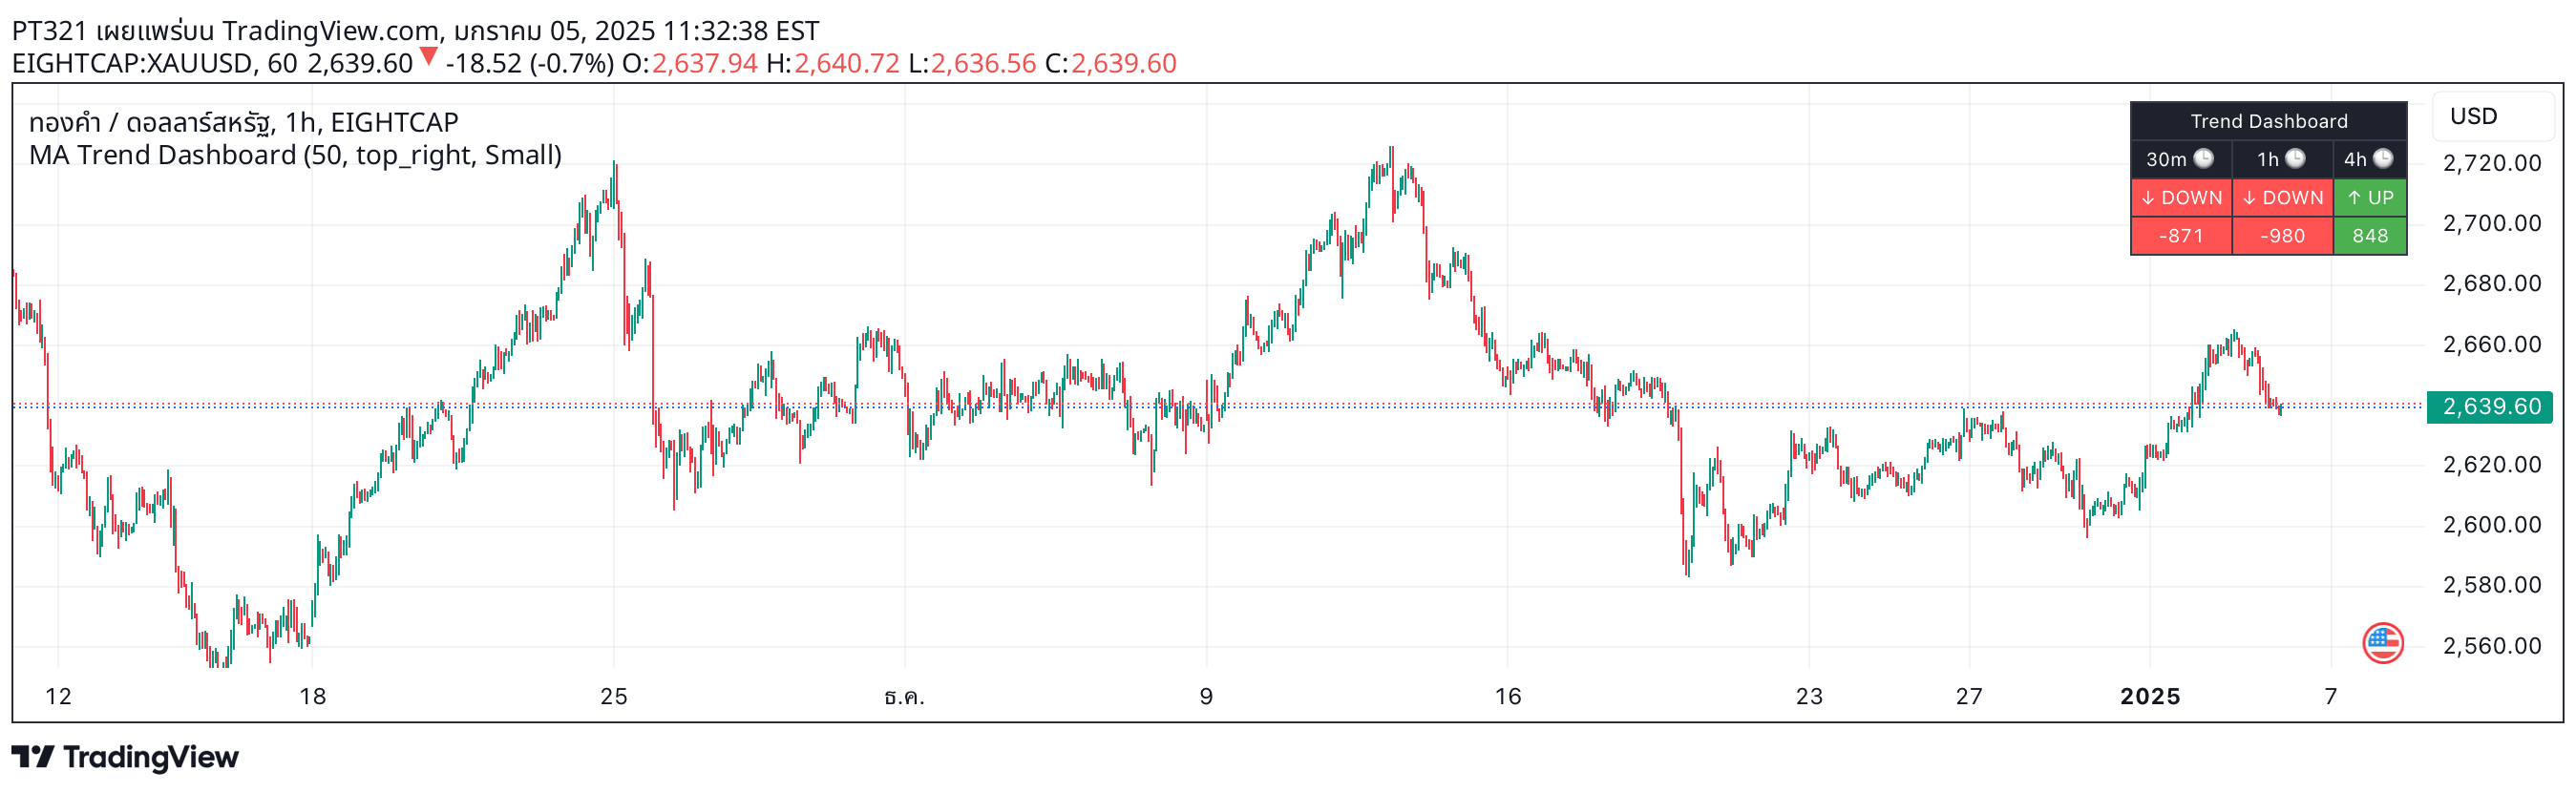
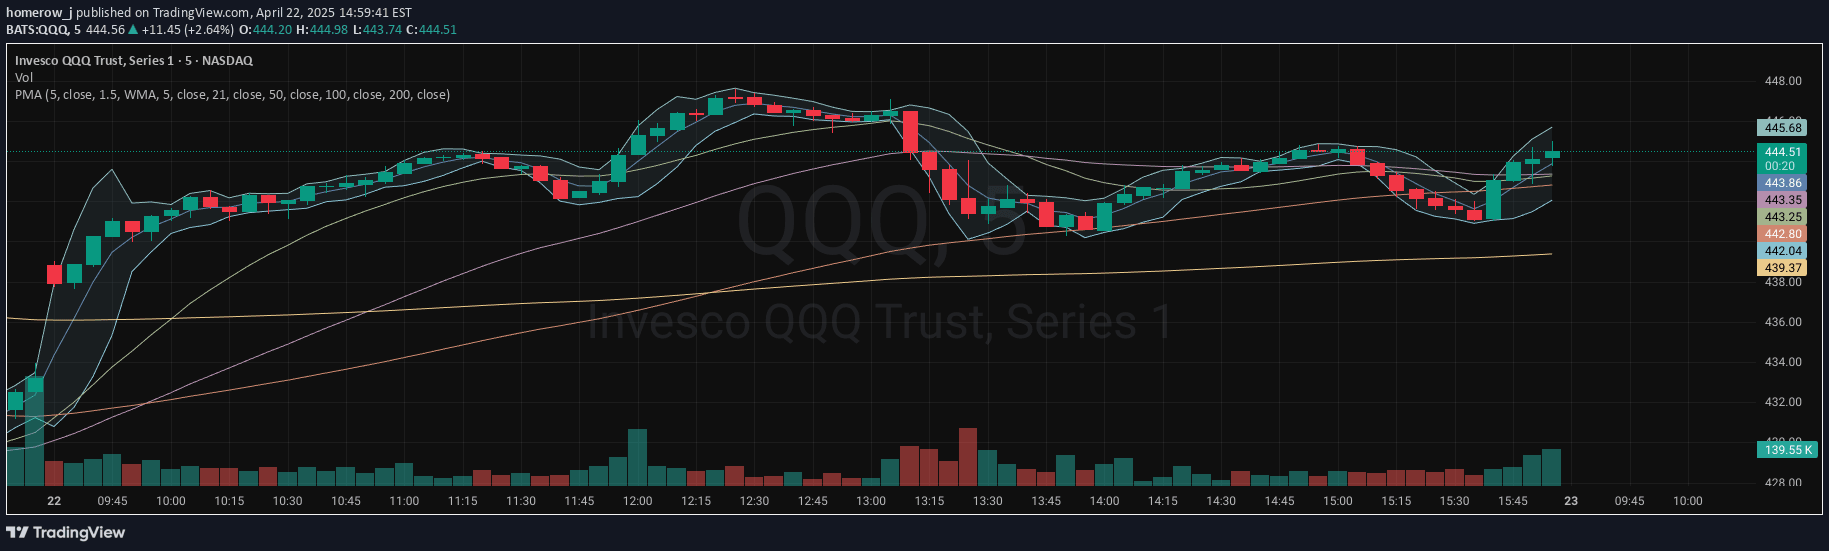
A comprehensive multi-timeframe SMA dashboard tracking trend direction, price positioning, and momentum across 10 different moving average lengths for in-depth market analysis.
Explore complementary indicator rolesHow it works
The Multi-SMA Dashboard calculates ten Simple Moving Averages (SMAs) with customizable lengths, ranging from short to long-term periods. For each SMA, the script determines its current trend direction by comparing the current and previous SMA values, classifying them as Up, Down, or Flat.
The dashboard further analyzes each SMA by comparing the current price to its level and calculating the angle of movement. This provides traders with a multi-dimensional view of market momentum, showing not just direction but also the strength and rate of price change across different timeframes.
Why it may be useful
Traders need comprehensive market analysis tools that can quickly synthesize complex price information across multiple timeframes. This dashboard provides an instant, visual representation of trend dynamics, allowing traders to understand market momentum at a glance and make more informed trading decisions.
By presenting trend information for ten different SMA lengths simultaneously, the script helps traders identify potential trend shifts, confirm market directions, and assess the overall strength of price movements across short, medium, and long-term perspectives.
When to explore it
The Multi-SMA Dashboard is most effective during trending markets where clear directional movements are present. It works exceptionally well for traders seeking to understand complex market dynamics across multiple timeframes, helping to confirm trend strength and potential trend changes.
Traders can utilize this tool during both volatile and stable market conditions, adjusting the SMA lengths to match their specific trading style and the characteristics of the financial instrument they are analyzing. It is particularly useful for traders who want a comprehensive, multi-timeframe view of market momentum.
Keep exploring
What we’ve verified
Access, alerts and repainting behaviour have not been independently verified for this indicator. Check the creator’s current publication and settings.
General descriptions and classifications are recovered research. Verified details above identify the specific checks we have completed. Check the creator’s current publication for later changes.