
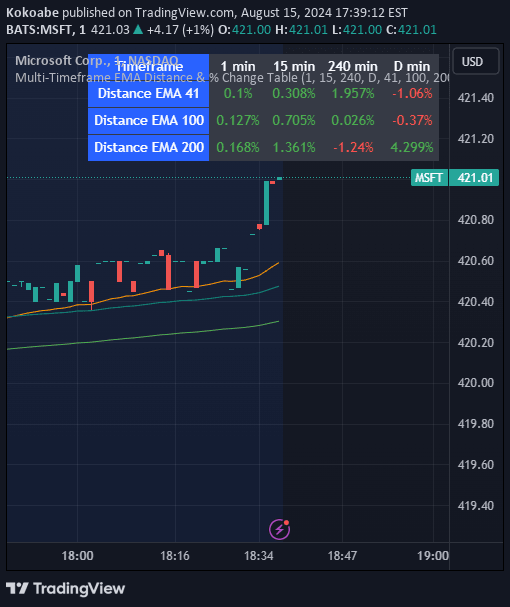
A multi-timeframe EMA indicator that tracks price distance and percentage change across different timeframes, providing a comprehensive view of trend dynamics and momentum.
Explore complementary indicator rolesHow it works
The Multi-Timeframe EMA Distance & % Change Table calculates exponential moving averages (EMAs) at three specified levels across multiple user-defined timeframes. It computes the distance between the current price and each EMA, presenting these values in a dynamic table with color-coded entries.
Traders can choose to view either absolute distances or percentage changes, with customizable decimal precision for accurate analysis. The indicator uses distinct colors for different EMA levels and plots them on the chart, allowing for quick visual interpretation of price positioning relative to moving averages.
Why it may be useful
This indicator provides traders with a comprehensive, multi-dimensional view of price momentum and trend strength across different timeframes. By showing the relationship between current price and EMAs, it helps traders quickly assess market trends, potential support and resistance levels, and overall price positioning.
The flexible display options and precise calculations enable traders to make more informed decisions by understanding price movements from multiple perspectives. The color-coded table and chart overlays make it easy to quickly interpret complex price dynamics.
When to explore it
The Multi-Timeframe EMA Distance & % Change Table is most effective during trending markets where price movement relative to moving averages provides meaningful insights. It is particularly useful for traders looking to confirm trend strength, identify potential trend reversals, and assess price momentum across different timeframes.
Traders can leverage this indicator in various market conditions, from scalping to swing trading, by adjusting timeframe settings and decimal precision to match their specific trading strategy and analysis requirements.
Keep exploring
What we’ve verified
Access, alerts and repainting behaviour have not been independently verified for this indicator. Check the creator’s current publication and settings.
General descriptions and classifications are recovered research. Verified details above identify the specific checks we have completed. Check the creator’s current publication for later changes.


