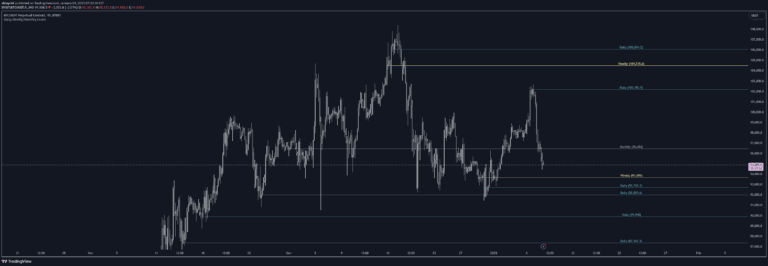
A multi-timeframe indicator that plots recent price highs and lows across various time intervals, helping traders identify critical support and resistance levels for strategic trading decisions.
Explore complementary indicator rolesHow it works
The Multi-Timeframe Highs and Lows indicator systematically analyzes price action across multiple timeframes, ranging from 15-minute to monthly charts. It identifies and plots the most recent significant high and low points, creating a comprehensive visual representation of key price levels.
By using customizable lookback periods, the indicator dynamically extends lines and places labels with advanced logic to prevent overlap. This ensures traders can clearly see critical support and resistance zones without chart clutter, making it easier to interpret complex price structures.
Why it may be useful
Traders need precise insights into market structure, and this indicator provides a multi-dimensional view of price dynamics across different time horizons. By revealing key levels simultaneously, it helps traders understand market context, potential trend reversals, and critical support/resistance zones.
The ability to customize colors, styles, and timeframe ranges makes this tool adaptable to various trading strategies. Whether a trader is focused on short-term scalping or long-term trend following, the indicator offers actionable information for making informed trading decisions.
When to explore it
This indicator is most effective when traders want to analyze market structure across multiple timeframes simultaneously. It proves particularly valuable during periods of market transition, where understanding support and resistance levels can help predict potential price movements and breakout opportunities.
Traders should leverage this tool during range-bound markets, trend reversals, and when seeking to confirm entry and exit points. Its versatility makes it suitable for different market conditions, helping traders identify potential trade setups with enhanced precision and confidence.
Keep exploring
What we’ve verified
Access, alerts and repainting behaviour have not been independently verified for this indicator. Check the creator’s current publication and settings.
General descriptions and classifications are recovered research. Verified details above identify the specific checks we have completed. Check the creator’s current publication for later changes.