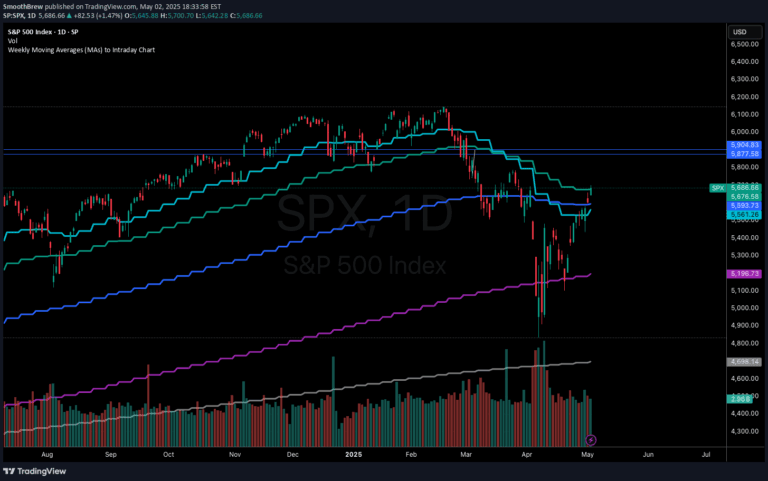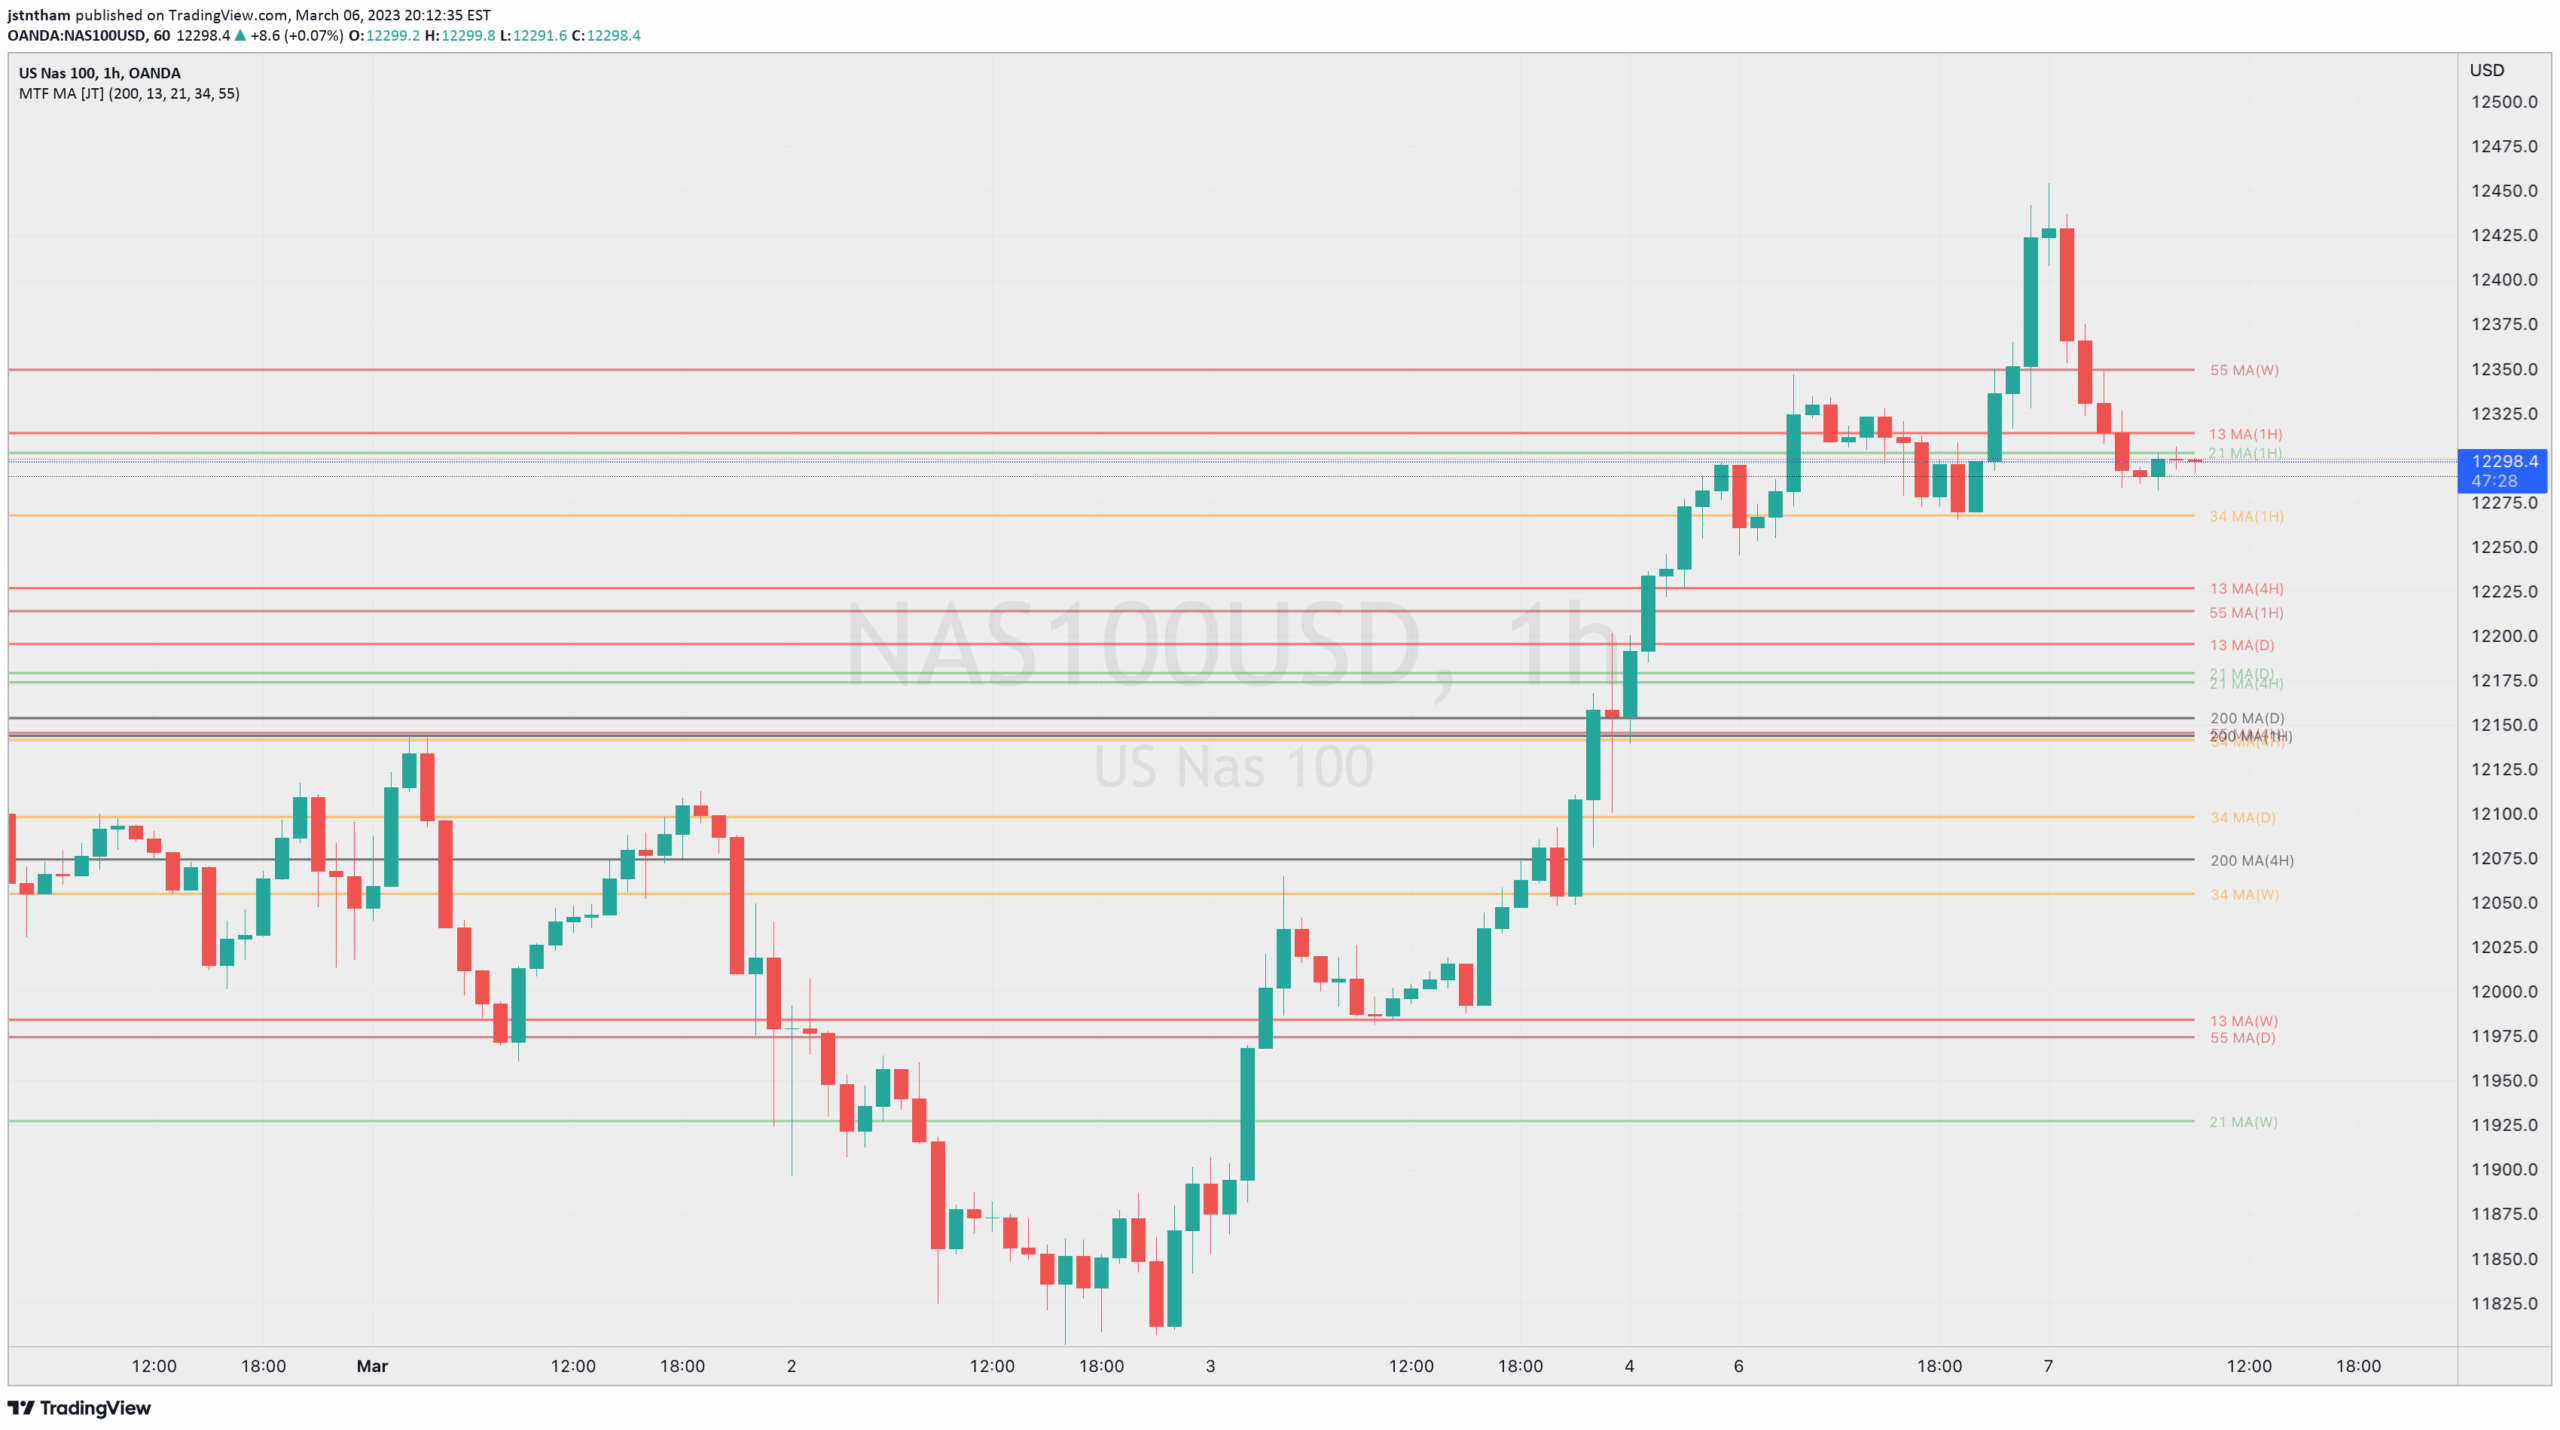
A multi-interval exponential moving average (EMA) indicator that helps traders analyze market trends by displaying five customizable EMAs across weekly, daily, 4-hourly, and hourly timeframes.
Explore complementary indicator rolesHow it works
The indicator calculates and displays five exponential moving averages across four different time intervals: weekly, daily, 4-hourly, and hourly. Traders can select their preferred moving averages, which are then plotted as dynamic lines on the chart that update in real-time based on current EMA values. Each line represents the smoothed average price over a specific period, giving more weight to recent price data.
The flexibility of this indicator allows users to customize their analysis by choosing specific moving averages and enabling or disabling intervals as needed. The lines adapt continuously, providing a visual representation of price trends and potential momentum shifts across multiple timeframes simultaneously.
Why it may be useful
This multi-interval EMA indicator provides traders with a comprehensive view of market trends by showing price momentum across different time horizons. By displaying multiple moving averages simultaneously, traders can gain deeper insights into market dynamics, helping them make more informed trading decisions.
The visual representation allows quick identification of trend directions and potential trend changes. The ability to customize and overlay multiple EMAs enables traders to develop more nuanced trading strategies. Traders can use these overlapping moving averages to confirm trend strength, identify potential support and resistance levels, and potentially anticipate market movements across different timeframes.
When to explore it
This indicator is most effective in markets with clear trending behavior, where price movements show consistent directional momentum. Traders can utilize this tool during periods of stable market conditions, such as in trending cryptocurrency, forex, or stock markets. It works best when combined with other technical analysis tools to confirm signals and provide additional context.
The multi-interval approach is particularly useful for traders who want to maintain a holistic market perspective, allowing them to simultaneously analyze short-term and long-term trends. By providing a comprehensive view across different timeframes, the indicator helps traders make more strategic entry and exit decisions, reducing the risk of trading based on limited temporal information.
Keep exploring
What we’ve verified
Access, alerts and repainting behaviour have not been independently verified for this indicator. Check the creator’s current publication and settings.
General descriptions and classifications are recovered research. Verified details above identify the specific checks we have completed. Check the creator’s current publication for later changes.