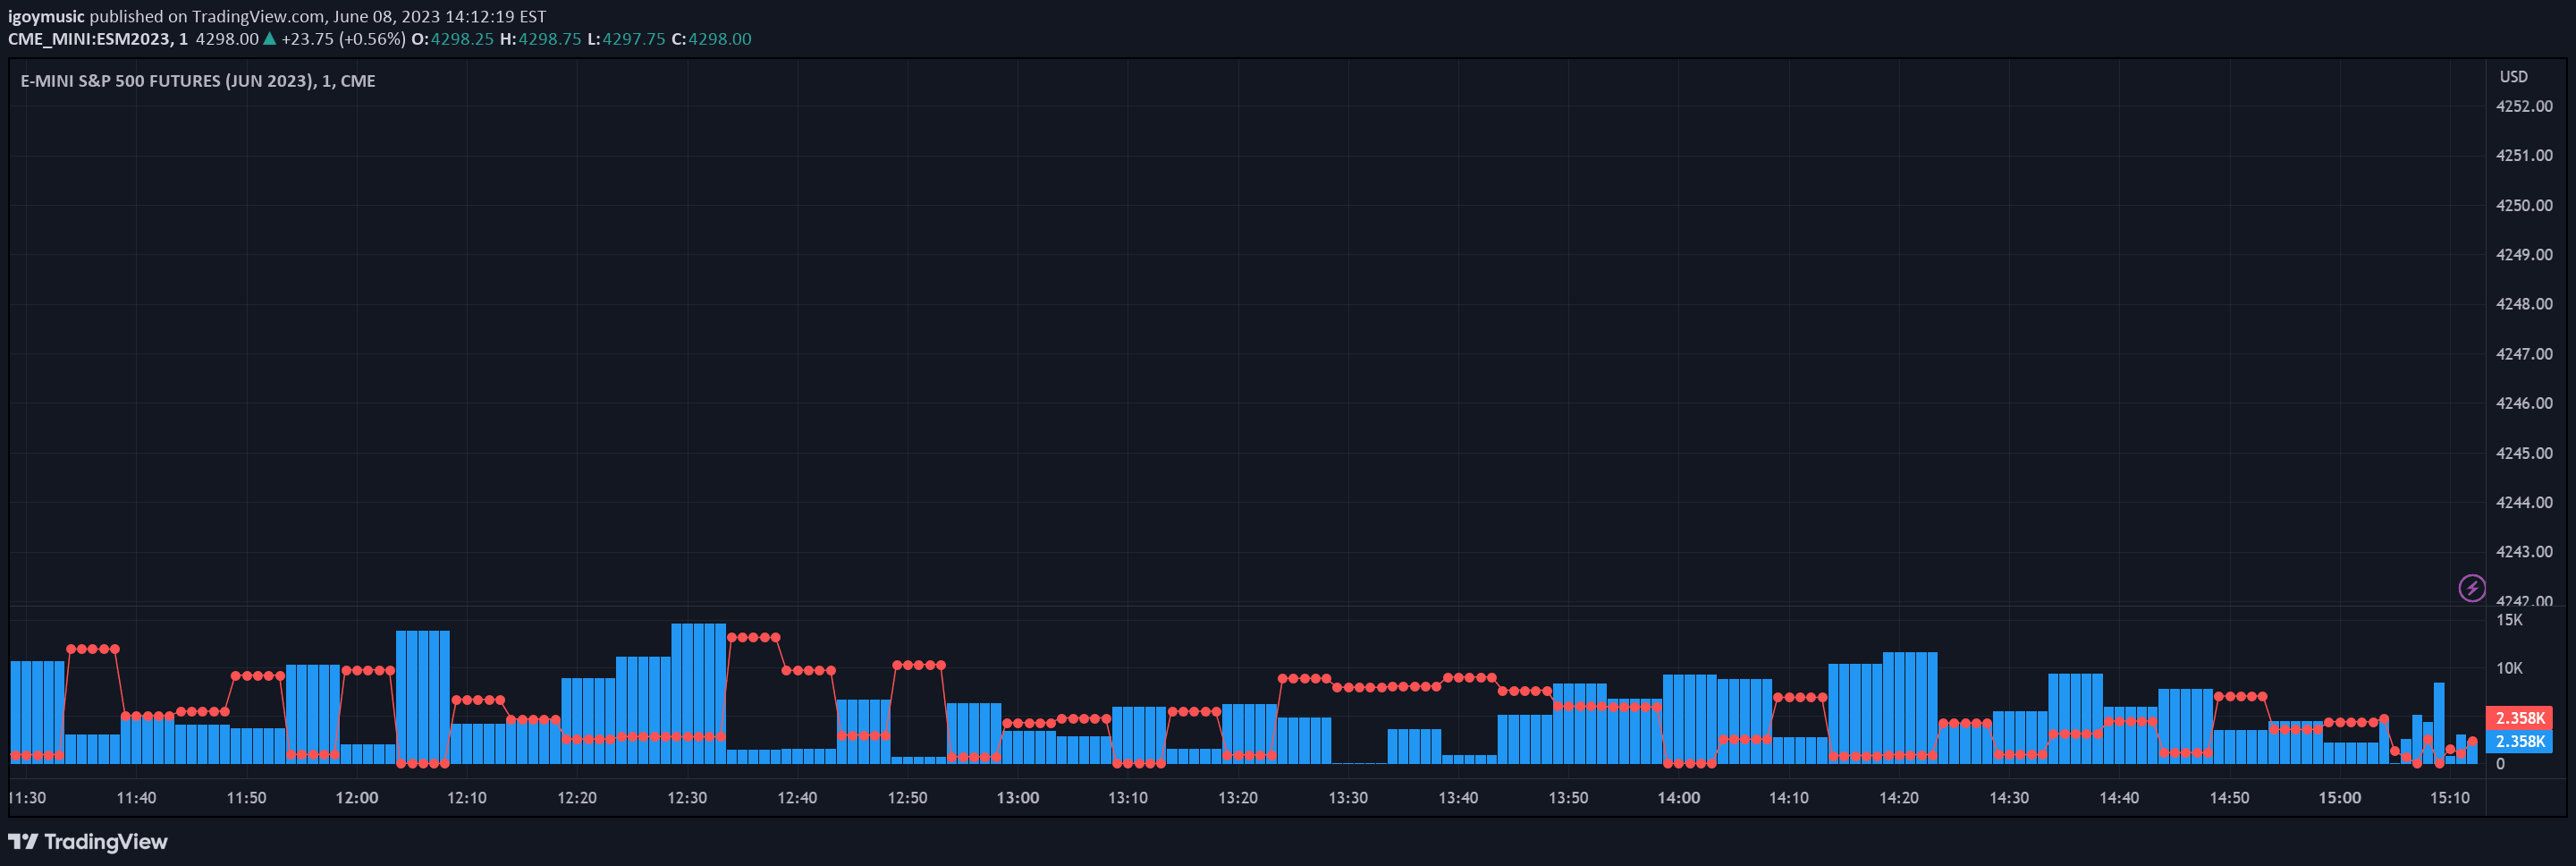
A multi-timeframe volume indicator that displays volume data across five user-selected intervals, providing color-coded volume trends and changes for quick market analysis.
Explore complementary indicator rolesHow it works
The Multi TimeFrame Volume script creates a comprehensive volume analysis table that tracks volume across five different timeframes. It calculates the volume for each selected interval and formats the values in thousands (K) or millions (M) for easy readability.
The script then applies a color-coding system to visually represent volume changes, using green to indicate volume increases, red for decreases, and gray for unchanged values. This color-coded approach allows traders to quickly interpret volume trends and potential market momentum at a glance.
Why it may be useful
Volume is a critical indicator of market strength and potential price movements, providing insights into the conviction behind price actions. By presenting volume data across multiple timeframes simultaneously, traders can gain a more comprehensive understanding of market dynamics and potential trend confirmations.
The color-coded presentation makes it easier for traders to quickly assess volume changes, helping them make more informed trading decisions. This multi-timeframe approach allows for a more nuanced view of market activity, revealing potential divergences or confirmations that might not be apparent when looking at a single timeframe.
When to explore it
This volume indicator is most effective during periods of active market trading, particularly for traders who want a comprehensive view of volume trends across different time intervals. It is especially useful during volatile market conditions where volume can provide critical insights into potential price movements.
Traders should use this tool when they want to confirm trend strength, identify potential reversals, or understand the underlying market sentiment across multiple timeframes. It is particularly valuable for day traders and scalpers who rely on quick, data-driven decision-making based on volume and market momentum.
Keep exploring
What we’ve verified
Access, alerts and repainting behaviour have not been independently verified for this indicator. Check the creator’s current publication and settings.
General descriptions and classifications are recovered research. Verified details above identify the specific checks we have completed. Check the creator’s current publication for later changes.