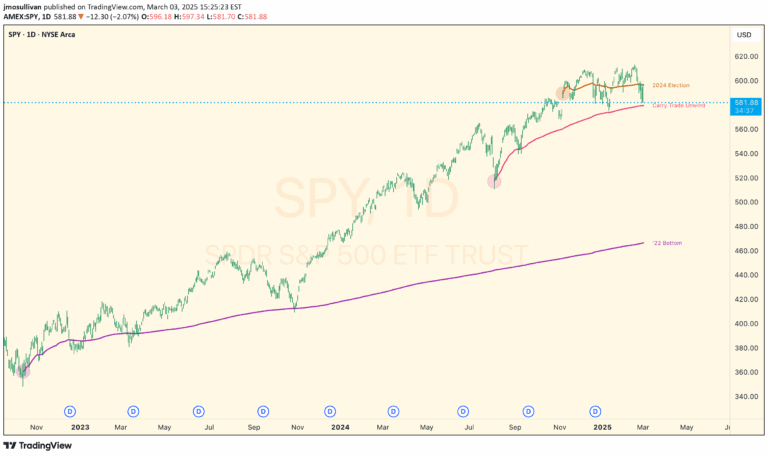
Multi VWAP tool that creates automatic Anchored Volume Weighted Average Price lines from significant market gaps across different time periods, providing insights into market structure and institutional trading dynamics.
Explore complementary indicator rolesHow it works
The Multi VWAP from Gaps tool automatically generates Anchored VWAP lines starting from the most significant price gaps in weekly, monthly, quarterly, and yearly timeframes. It calculates the Volume Weighted Average Price by summing the product of price and volume, divided by total volume, from a specific anchor point representing a major market gap.
The tool allows traders to customize the number of VWAP lines displayed and toggle label visibility for different time periods. By identifying these anchor points, the indicator helps traders understand how past price gaps have potentially influenced current market structure and price action.
Why it may be useful
VWAP provides an objective measure of the average price traders have paid for a security over a specific period, which is particularly valuable for understanding institutional trading dynamics. Large institutional investors often use these price levels as critical reference points for trade entries and exits, making the Multi VWAP tool a powerful analytical resource.
By highlighting significant gaps and their corresponding VWAP lines, traders can gain insights into potential support and resistance levels, market sentiment, and potential trend changes. The tool offers a systematic approach to identifying key price levels that might otherwise require manual calculation and tracking.
When to explore it
The Multi VWAP from Gaps tool is most effective during periods of significant market events like earnings reports, FOMC meetings, or economic data releases that can cause substantial price gaps. Traders can use this indicator to identify potential trend reversals, support and resistance levels, and assess whether buyers or sellers are currently in control of the price action.
It is particularly useful for traders who want to understand market structure beyond traditional technical analysis tools. The indicator can help confirm trading signals, provide additional context for entry and exit decisions, and offer a more nuanced view of price dynamics across different time horizons.
Keep exploring
What we’ve verified
Access, alerts and repainting behaviour have not been independently verified for this indicator. Check the creator’s current publication and settings.
General descriptions and classifications are recovered research. Verified details above identify the specific checks we have completed. Check the creator’s current publication for later changes.