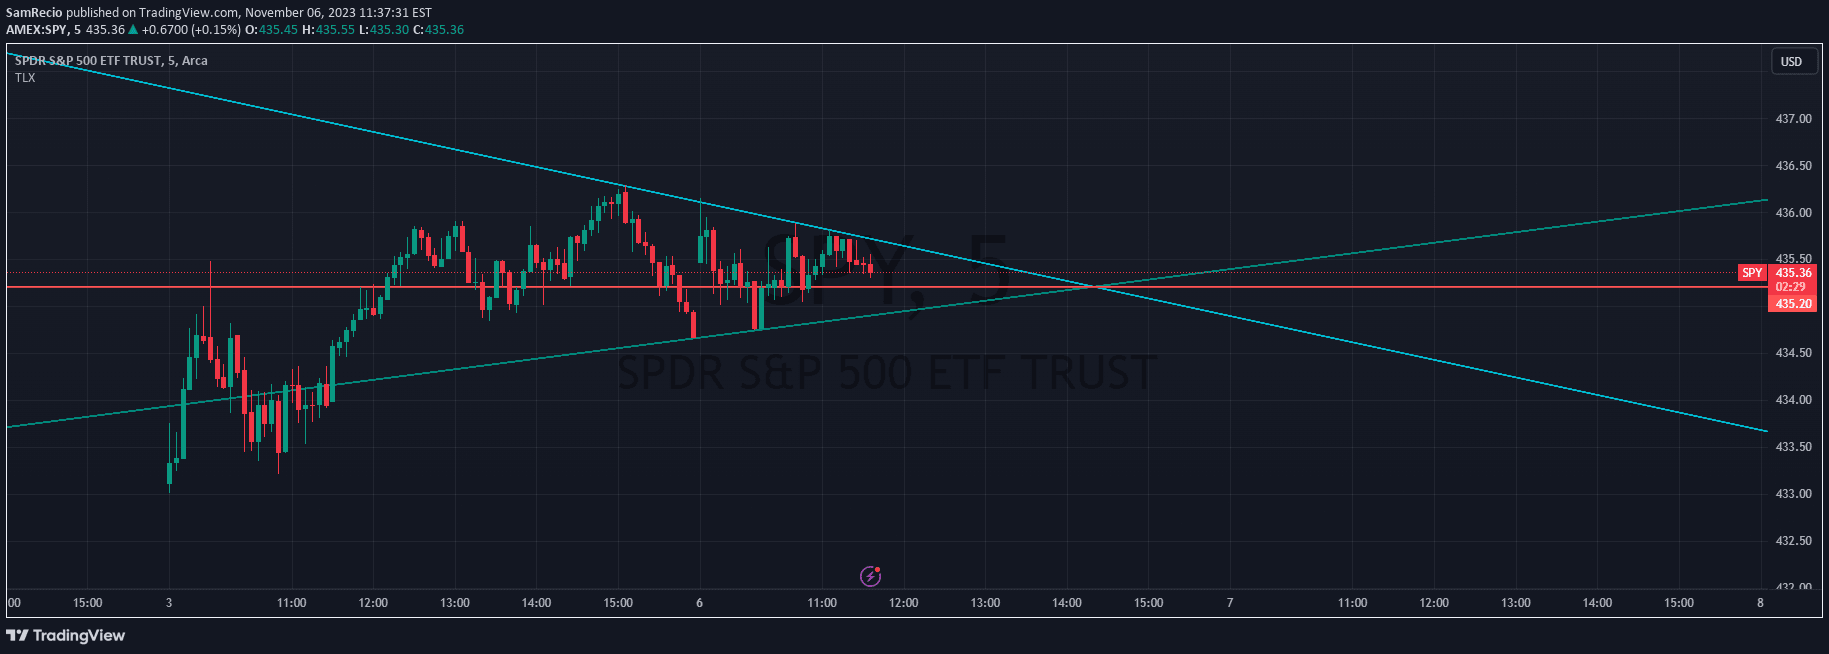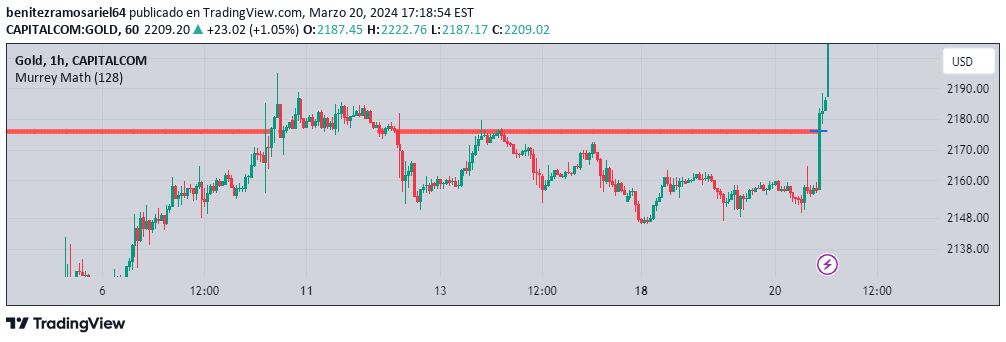
Murrey Math is a technical analysis tool that calculates specific horizontal price levels, helping traders identify potential support, resistance, and price rotation points.
Explore complementary indicator rolesHow it works
The Murrey Math indicator calculates unique price levels by dividing a specific price range into segments, typically using numbers like 8, 16, 32, 64, 128, or 256. To determine these levels, traders first divide the current price by the chosen range and round the result to the nearest whole number, then multiply that number by the original range.
This calculation creates a series of horizontal lines on the price chart, representing potential support and resistance zones. These levels are strategically positioned to help traders anticipate where prices might react, pivot, or change direction based on the mathematical framework developed by T.J. Murray.
Why it may be useful
The Murrey Math indicator provides traders with a systematic approach to identifying potential price turning points and trading opportunities across different financial markets. By offering a structured method for recognizing support and resistance levels, it helps traders make more informed decisions about market entry, exit, and risk management.
Unlike subjective technical analysis methods, Murrey Math offers a mathematical framework that can be applied consistently across various assets and timeframes. This approach allows traders to develop more disciplined trading strategies by providing clear, predefined levels where price reactions are more likely to occur.
When to explore it
The Murrey Math indicator performs best in markets that exhibit range-bound or mean-reverting behavior, such as forex, futures, and certain stocks with predictable trading patterns. It is particularly effective on higher timeframes like daily or weekly charts, where price movements tend to respect structural levels more consistently.
Traders should consider using Murrey Math when seeking to identify potential support and resistance zones, manage risk by placing stop-loss orders near these levels, and develop more structured trading strategies. The indicator is especially useful in markets with moderate volatility and when combined with other technical analysis tools to confirm potential trade setups.
Keep exploring
What we’ve verified
Access, alerts and repainting behaviour have not been independently verified for this indicator. Check the creator’s current publication and settings.
General descriptions and classifications are recovered research. Verified details above identify the specific checks we have completed. Check the creator’s current publication for later changes.