
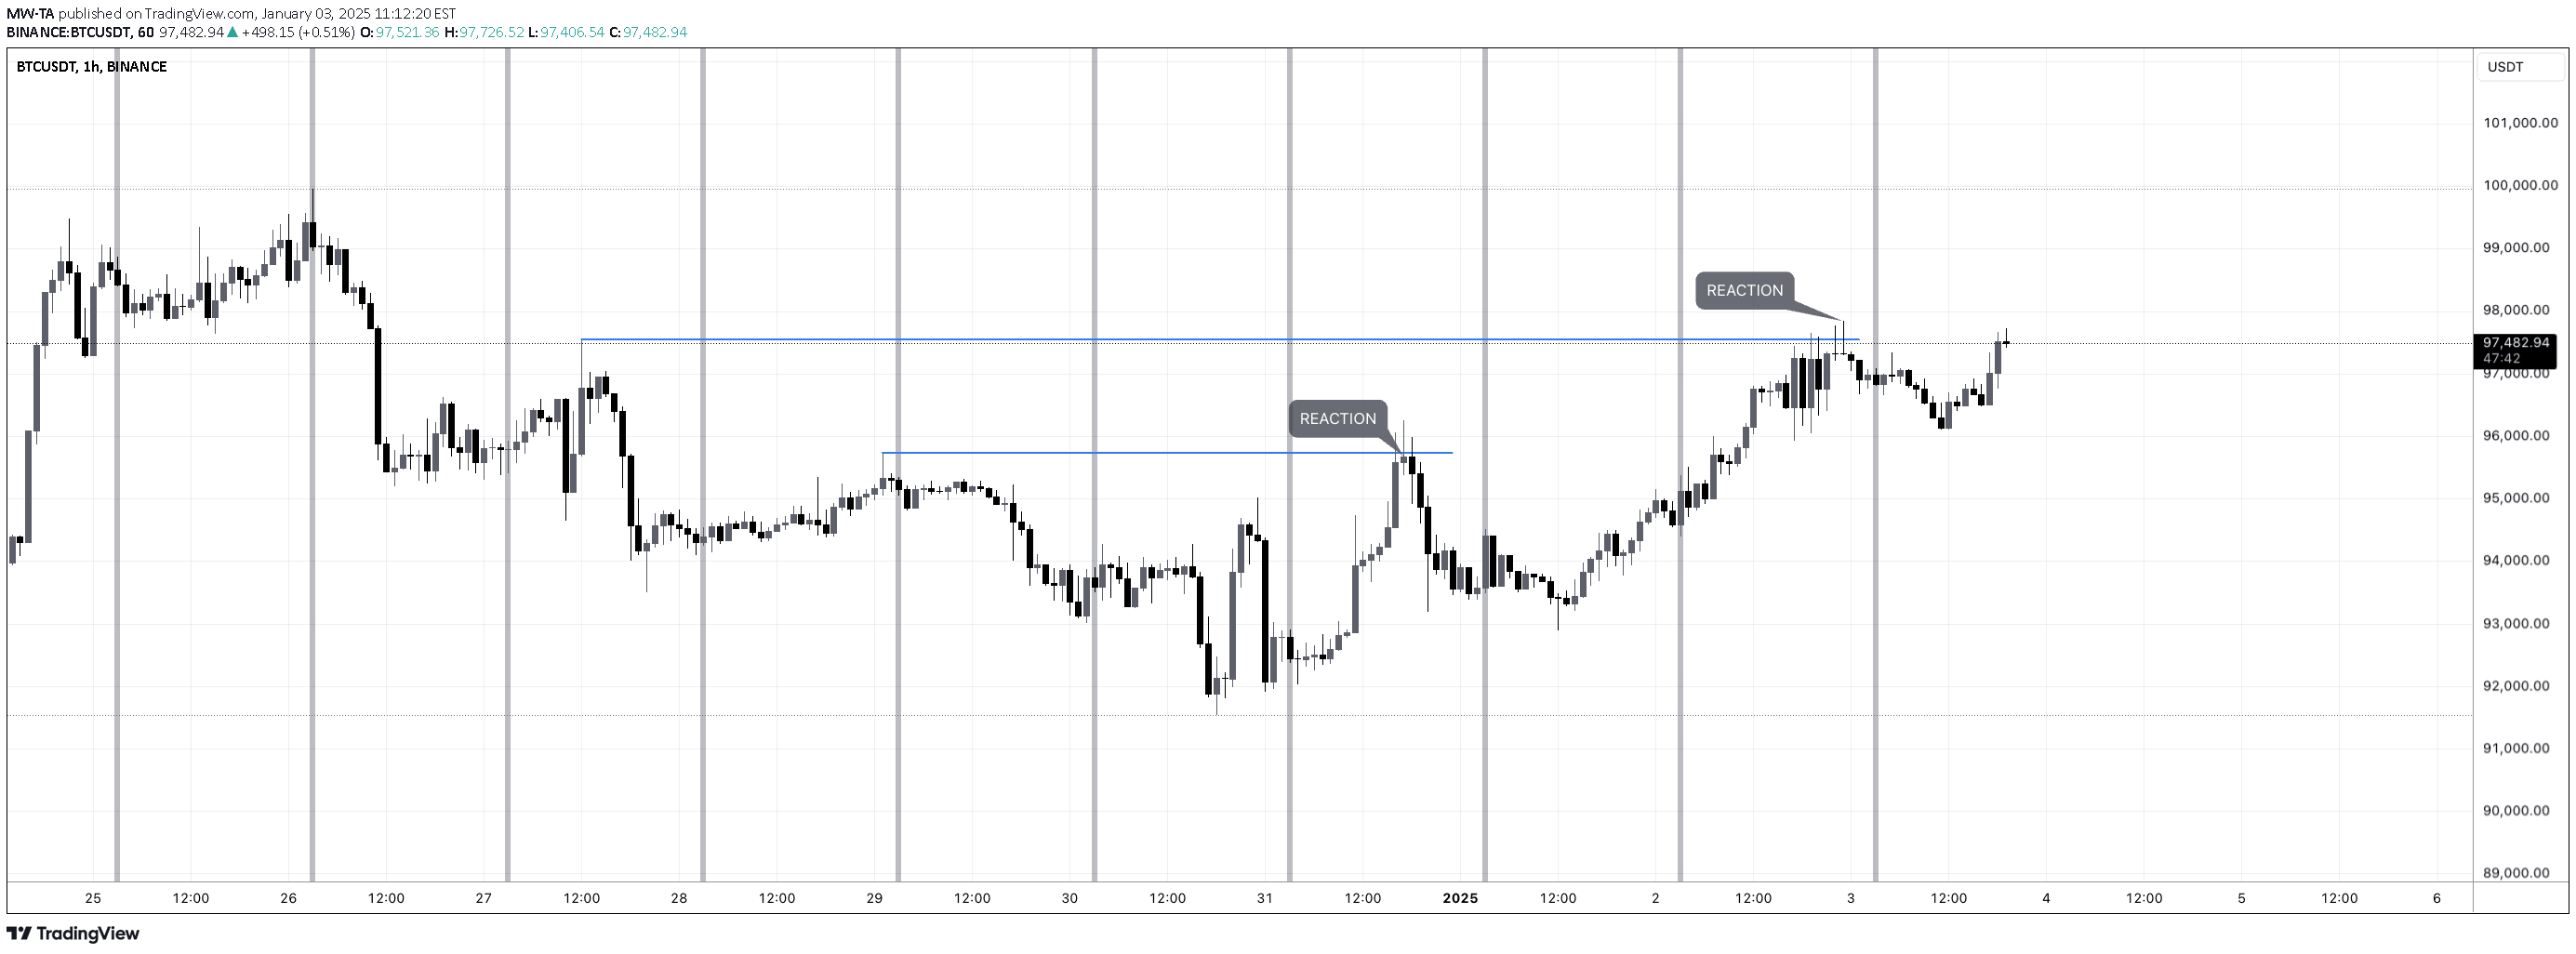
A trading tool with vertical separators to visually identify weekly periods and analyze liquidity grabs across different financial markets, helping traders detect price reactions.
Explore complementary indicator rolesHow it works
The signal uses vertical separators to divide the chart into distinct weekly segments, allowing traders to easily track time-based market movements. By manually marking liquidity grab zones, traders can identify specific price levels where significant trading activity occurred.
These separators help visualize market structure by highlighting different trading days and potential liquidity zones. Traders can use these visual markers to analyze how price reacts when key liquidity levels are approached or breached.
Why it may be useful
The signal provides traders with a structured approach to understanding market dynamics across different timeframes and financial instruments. By revealing liquidity grab patterns, traders can gain insights into potential price reactions and market sentiment.
Understanding liquidity zones helps traders make more informed decisions about entry and exit points. This tool is versatile and can be applied to multiple markets, including forex, crypto, indexes, stocks, and commodities.
When to explore it
The signal is most effective when analyzing markets with clear liquidity dynamics and consistent weekly patterns. Traders should use this tool when they want to identify potential turning points in price based on liquidity grab zones.
It works best for traders who focus on short to medium-term trading strategies and want to understand the underlying market structure. The vertical separators and liquidity analysis are particularly useful during periods of market consolidation or when looking for potential trend reversal points.
Keep exploring
What we’ve verified
Access, alerts and repainting behaviour have not been independently verified for this indicator. Check the creator’s current publication and settings.
General descriptions and classifications are recovered research. Verified details above identify the specific checks we have completed. Check the creator’s current publication for later changes.


