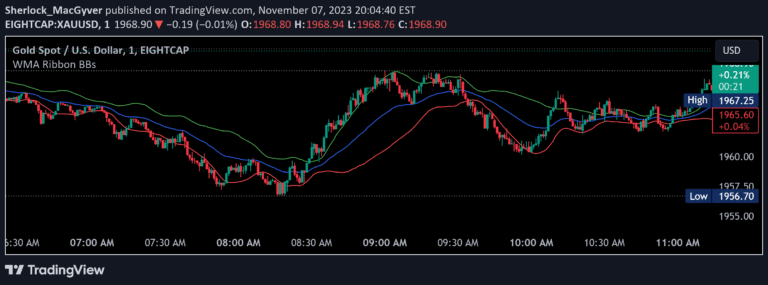
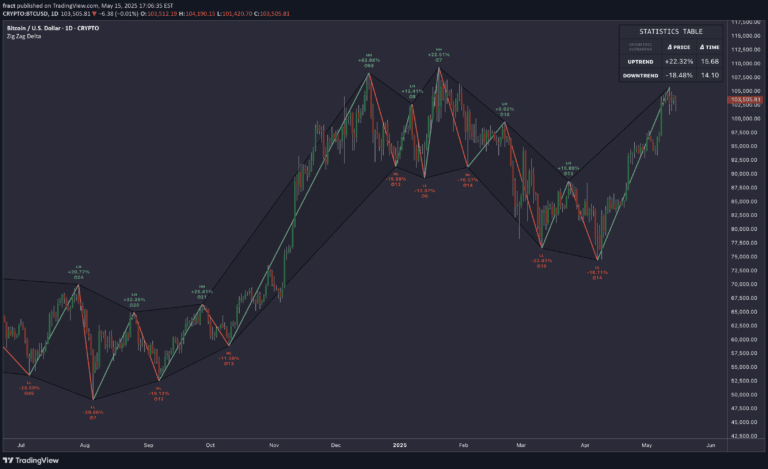
A comprehensive trading indicator combining multiple technical analysis tools into a single, customizable overlay for traders seeking a streamlined and versatile market analysis approach.
Explore complementary indicator rolesHow it works
The S.T.A.C.K. indicator integrates five key technical analysis components, starting with customizable moving averages that track price trends and momentum. These moving averages can be configured using different calculation methods like Simple, Exponential, or Weighted Moving Averages, allowing traders to adapt to various market conditions.
Additionally, the indicator incorporates Bollinger Bands to measure volatility, Donchian Channels to identify breakouts, and ATR Bands to establish dynamic support and resistance zones. By combining these tools, traders receive a comprehensive view of market dynamics, helping them make more informed trading decisions.
Why it may be useful
Technical analysis tools are crucial for understanding market behavior, and the S.T.A.C.K. indicator simplifies this process by consolidating multiple indicators into a single, easy-to-read overlay. By providing a holistic view of price movements, volatility, and potential trend reversals, traders can quickly assess market conditions without switching between multiple indicators.
The customizable nature of the S.T.A.C.K. indicator allows traders to personalize their analysis, ensuring the tool adapts to individual trading strategies and preferences. This flexibility, combined with the comprehensive market insights, makes the indicator a powerful tool for traders seeking efficiency and depth in their technical analysis.
When to explore it
The S.T.A.C.K. indicator is most effective in markets with clear trend characteristics, such as stocks, forex, and cryptocurrencies that exhibit consistent directional movements. Traders can leverage this tool during periods of moderate to high volatility, where multiple technical indicators can provide more reliable signals.
It is particularly useful for traders looking to confirm trend strength, identify potential entry and exit points, and manage risk through adaptive support and resistance zones. The indicator's versatility makes it suitable for various trading styles, from short-term scalping to longer-term swing trading strategies.
Keep exploring
What we’ve verified
Access, alerts and repainting behaviour have not been independently verified for this indicator. Check the creator’s current publication and settings.
General descriptions and classifications are recovered research. Verified details above identify the specific checks we have completed. Check the creator’s current publication for later changes.