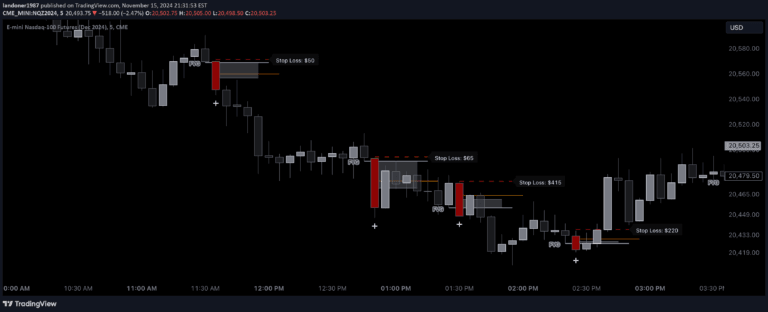
The 123 pattern is a powerful candlestick formation that identifies potential trend reversals by analyzing three consecutive candles, revealing bullish or bearish market sentiment shifts.
Explore complementary indicator rolesHow it works
The 123 pattern operates by analyzing three consecutive candles to detect potential trend reversals. For a bullish reversal, the first candle is a large red candle indicating selling pressure, followed by a small indecision candle, and then a green candle showing strong buying momentum.
The bearish version follows the opposite structure. Traders look for the third candle to be at least 70% the size of the first candle, signaling a potential trend change. The pattern forms a distinct 'U' or inverted 'U' shape on the price chart, highlighting a potential shift in market sentiment
Why it may be useful
The 123 pattern is crucial for traders because it provides a simple yet effective method to identify potential trend reversals without relying on complex indicators. It helps traders spot early signs of market sentiment changes, allowing for more precise entry and exit points.
The pattern is based purely on price action, making it universally applicable across different markets and timeframes. By recognizing these key candlestick formations, traders can anticipate potential trend changes and make more informed trading decisions
When to explore it
The 123 pattern works best in trending markets with clear directional movements. It is most effective when used in conjunction with other technical analysis tools and confirmation signals.
Traders should look for this pattern after a sustained trend, either bullish or bearish, where the reversal potential is highest. It is particularly useful in markets with sufficient liquidity and volatility. Ideal market conditions include periods of consolidation or when there are clear support and resistance levels
Keep exploring
What we’ve verified
Access, alerts and repainting behaviour have not been independently verified for this indicator. Check the creator’s current publication and settings.
General descriptions and classifications are recovered research. Verified details above identify the specific checks we have completed. Check the creator’s current publication for later changes.