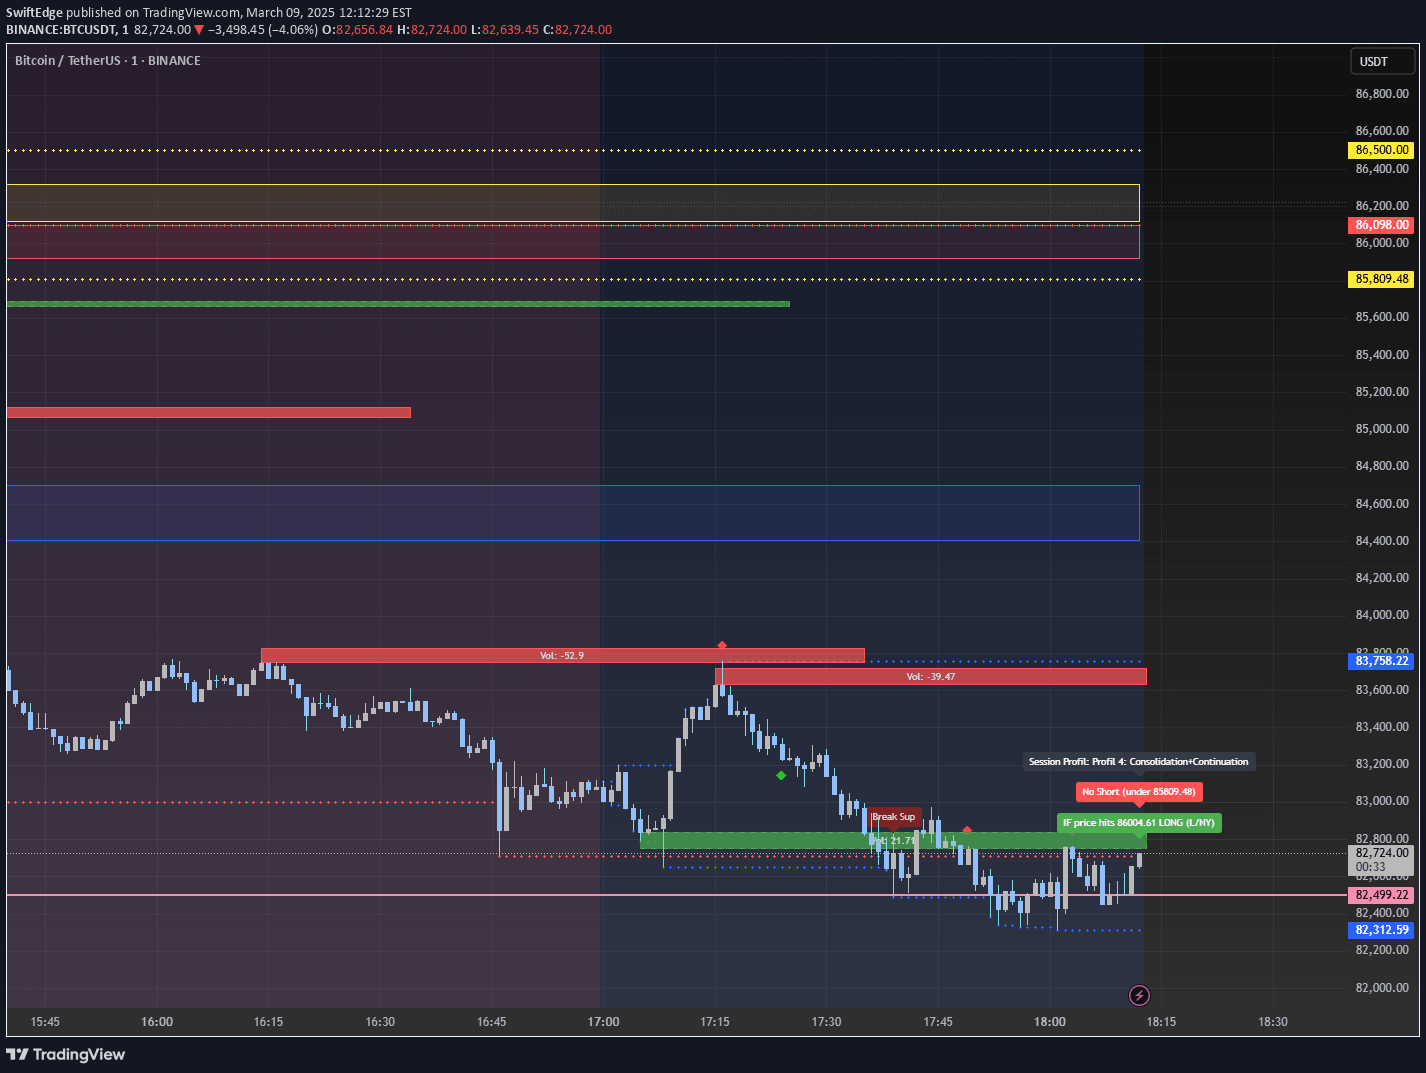
A trading tool that visualizes global market trading sessions, marking key price levels and session trends across major financial centers like London, New York, and Tokyo.
Explore complementary indicator rolesHow it works
The session indicator tracks and displays trading sessions for major global markets by marking specific time zones and calculating session trends. It determines session direction by comparing the opening price to the closing price, using the previous session's close if a gap exists before the current session's start.
The indicator automatically calculates the trend by subtracting the session's opening price from its closing price, providing a visual representation of market movement. For open sessions, it uses the current price to determine the trend, allowing real-time insights into market dynamics across different global trading centers.
Why it may be useful
Trading sessions indicator helps traders understand global market dynamics and identify potential trading opportunities across different time zones. By visualizing session highs, lows, and current status, traders can make more informed decisions about market entry and exit points.
The tool provides critical context for understanding market movements, especially for traders operating in international markets or those interested in tracking global economic interactions. Its ability to show session trends and customize session names makes it a valuable resource for both novice and experienced traders seeking comprehensive market insights.
When to explore it
This indicator is most effective on timeframes below 4 hours, providing granular insights into market session dynamics. Traders can utilize it to understand market sentiment, identify potential trend shifts, and recognize opportunities during specific global trading sessions.
It is particularly useful for day traders and scalpers who need real-time information about market sessions and their trends. By showing which sessions are currently open and their directional movement, the indicator helps traders make more precise and timely trading decisions across different global financial markets.
Keep exploring
What we’ve verified
Access, alerts and repainting behaviour have not been independently verified for this indicator. Check the creator’s current publication and settings.
General descriptions and classifications are recovered research. Verified details above identify the specific checks we have completed. Check the creator’s current publication for later changes.