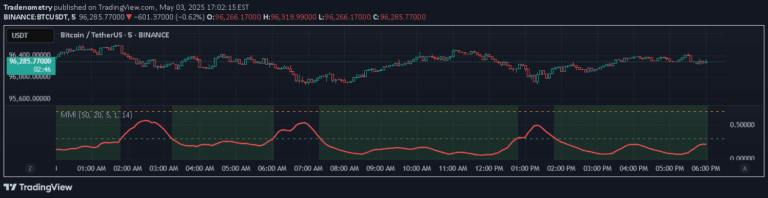
A linear regression indicator that uniquely analyzes price tops using a non-traditional approach, focusing on selecting and tracking specific price points for trend analysis.
Explore complementary indicator rolesHow it works
This linear regression indicator operates by analyzing price tops through a unique 'never go back' methodology, which selectively tracks and processes specific price points. It differs from traditional linear regression by focusing on reverse selection and capturing only the highest points in the price movement.
The algorithm identifies and connects the most significant price peaks, creating a trend line that represents the market's directional momentum. By prioritizing top values and implementing a non-conventional approach, the indicator generates a more specialized trend analysis that highlights potential price resistance and movement patterns.
Why it may be useful
The 'never go back' linear regression provides traders with a distinctive perspective on market trends by emphasizing price tops and their sequential relationships. This approach can reveal hidden market dynamics that traditional linear regression methods might overlook, offering insights into potential trend reversals and momentum shifts.
By focusing on peak price points, traders gain a nuanced understanding of market behavior that can help identify potential entry and exit points. The indicator's unique methodology allows for more targeted analysis, potentially improving decision-making in volatile or complex trading environments.
When to explore it
This indicator is most effective in markets with clear trending characteristics, where price tops can provide meaningful insights into potential future movements. It works best in timeframes that allow for sufficient price data to establish meaningful trend lines, such as short to medium-term trading scenarios.
Traders should consider using this indicator during periods of strong directional movement, where price peaks can be clearly identified and analyzed. It is particularly useful in markets with distinct bullish or bearish trends, where the selective top tracking can provide more refined trend analysis compared to traditional linear regression methods.
Keep exploring
What we’ve verified
Access, alerts and repainting behaviour have not been independently verified for this indicator. Check the creator’s current publication and settings.
General descriptions and classifications are recovered research. Verified details above identify the specific checks we have completed. Check the creator’s current publication for later changes.