
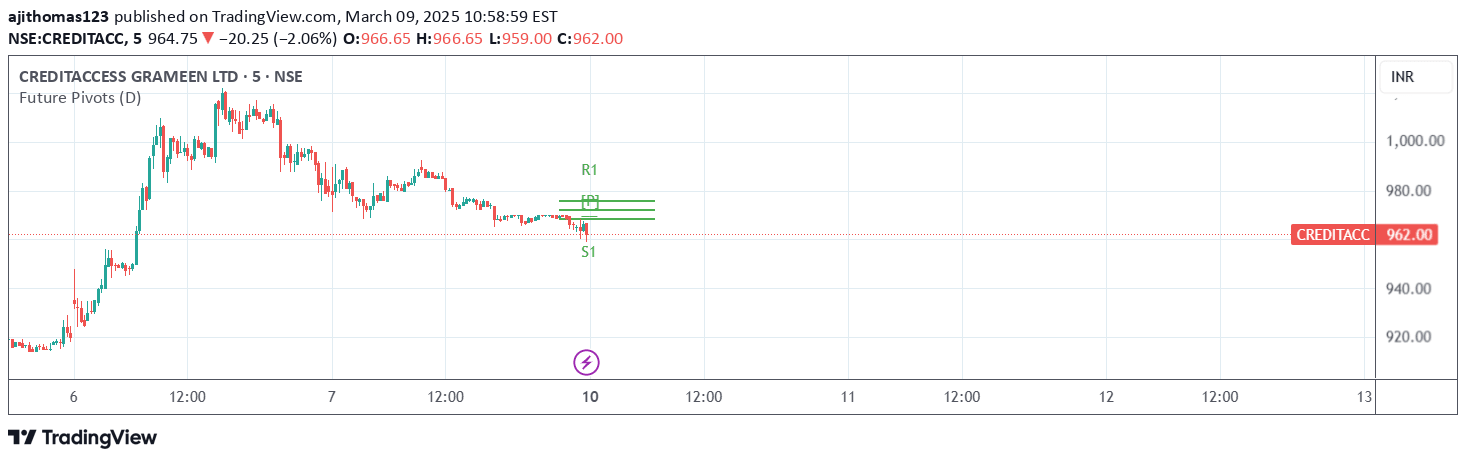
A Central Pivot Range (CPR) indicator that calculates pivot points, support and resistance levels, and extends them for the next trading session to help traders plan strategies.
Explore complementary indicator rolesHow it works
The Future CPR indicator calculates pivot points using the previous period's high, low, and close prices across multiple timeframes including daily, weekly, monthly, and yearly. It determines the Central Pivot Point (CPP) as the average of these key price levels and then computes additional support and resistance levels (S1, S2, S3, R1, R2, R3).
The indicator uniquely extends these pivot calculations to the next trading session, allowing traders to anticipate potential price movement zones in advance. By plotting these projected levels on the chart, it provides a visual representation of potential support and resistance areas traders can use for entry, exit, and stop-loss planning.
Why it may be useful
The Future CPR indicator is crucial for traders because it transforms raw price data into actionable strategic insights by revealing potential market turning points and critical price levels. It helps traders understand the underlying market structure and identifies key zones where price might react, pause, or reverse.
By providing a systematic approach to identifying support and resistance levels across multiple timeframes, the indicator helps traders make more informed decisions. It reduces emotional trading by offering a structured framework for understanding potential price behavior and helps traders develop more disciplined and objective trading strategies.
When to explore it
The Future CPR indicator is most effective when used for pre-market analysis and planning trading strategies in advance. It works particularly well in markets with clear trending or range-bound characteristics, where pivot points and support/resistance levels have demonstrated reliability in guiding price action.
Traders should ideally use this indicator after the current trading session closes to ensure accurate calculations and avoid real-time recalculations. It is especially valuable for day traders, swing traders, and those who prefer a structured approach to identifying potential entry and exit points based on methodical price level analysis.
Keep exploring
What we’ve verified
Access, alerts and repainting behaviour have not been independently verified for this indicator. Check the creator’s current publication and settings.
General descriptions and classifications are recovered research. Verified details above identify the specific checks we have completed. Check the creator’s current publication for later changes.


