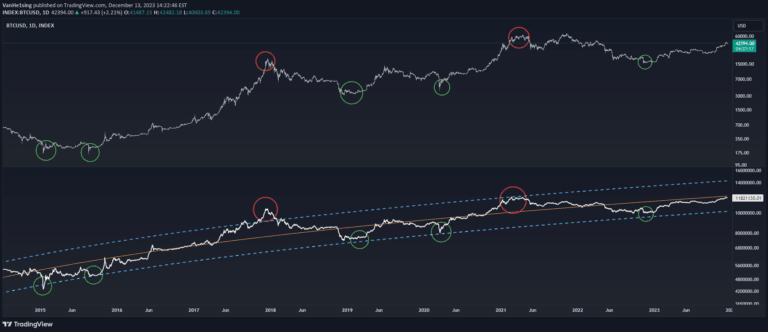
Normalized Price Volume (NPV) is an advanced indicator that combines normalized price changes and volume to provide insights into market dynamics and potential trend movements.
Explore complementary indicator rolesHow it works
The Normalized Price Volume (NPV) indicator operates by first using the Average True Range (ATR) to normalize price changes across different assets and timeframes. This normalization process ensures that price movements are comparably measured, regardless of the specific financial instrument being analyzed.
Once normalized, the indicator calculates the ratio between these adjusted price changes and trading volume. By combining these elements, NPV generates a comprehensive view of market dynamics, revealing the relationship between price movements and trading activity through a mathematically standardized approach.
Why it may be useful
The NPV indicator provides traders with a sophisticated tool for understanding market behavior beyond traditional price analysis. By normalizing price changes and integrating volume data, it offers a more nuanced perspective on potential trend strength and market sentiment.
This unique approach allows traders to identify subtle market dynamics that might be missed by conventional indicators. The ability to compare normalized data across different assets makes NPV particularly valuable for developing robust trading strategies that can adapt to varying market conditions.
When to explore it
The Normalized Price Volume indicator is most effective during periods of significant market activity where price and volume interactions provide meaningful insights. It works particularly well in markets with clear trending characteristics, helping traders confirm potential trend reversals or continuations.
Traders should consider using NPV when analyzing assets with varying volatility levels, as its normalization technique allows for more consistent interpretation across different financial instruments. It is especially useful when combined with other technical analysis tools to validate trading signals and improve overall decision-making accuracy.
Keep exploring
What we’ve verified
Access, alerts and repainting behaviour have not been independently verified for this indicator. Check the creator’s current publication and settings.
General descriptions and classifications are recovered research. Verified details above identify the specific checks we have completed. Check the creator’s current publication for later changes.