
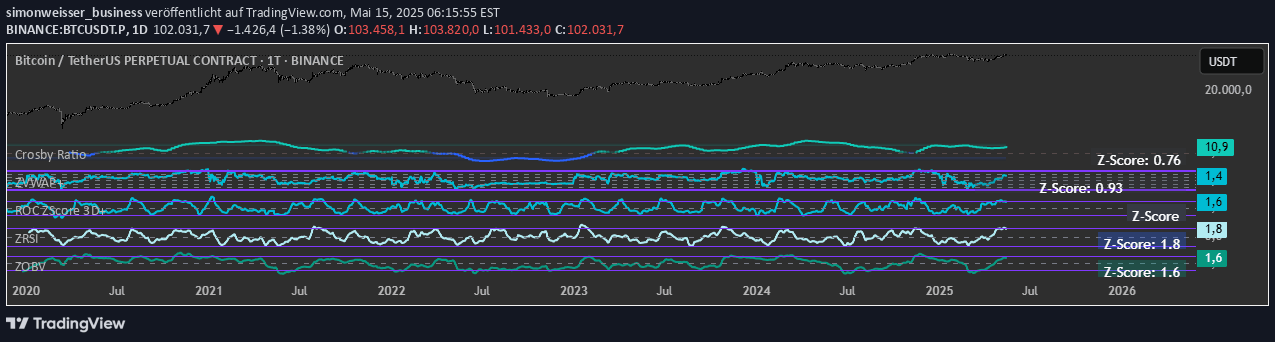
OBV Z-Score transforms On-Balance Volume into a normalized statistical view, revealing volume flow strength relative to recent market history using statistical normalization techniques.
Explore complementary indicator rolesHow it works
The On-Balance Volume (OBV) indicator accumulates volume based on price direction, tracking whether volume is flowing into or out of an asset. By converting OBV values into a Z-Score, the indicator normalizes volume data using the formula: Z = (OBV - Mean) / Standard Deviation.
This transformation reveals how unusual the current volume momentum is compared to its recent historical performance. The Z-Score is typically clamped between +2 and -2, with values outside this range indicating exceptionally strong volume pressure in either direction.
Why it may be useful
The OBV Z-Score provides traders with a statistically robust method of analyzing volume momentum, offering insights beyond traditional volume analysis. By normalizing volume data, it helps traders identify significant shifts in market sentiment that might be missed by conventional indicators.
The Z-Score transformation allows for more precise identification of volume-driven market movements, enabling traders to detect potential trend reversals or confirmations with greater statistical confidence. This approach transforms raw volume data into a more interpretable and actionable signal.
When to explore it
The OBV Z-Score is most effective in markets with clear volume-driven trends and during periods of significant price movement. Traders should look for Z-Score values crossing above +1.5 or below -1.5 as potential trading signals, indicating strong buying or selling volume pressure.
This indicator works best when combined with other technical analysis tools, such as price action indicators or trend-following signals. It is particularly useful in volatile markets where volume can provide critical insights into market sentiment and potential trend changes.
Keep exploring
What we’ve verified
Access, alerts and repainting behaviour have not been independently verified for this indicator. Check the creator’s current publication and settings.
General descriptions and classifications are recovered research. Verified details above identify the specific checks we have completed. Check the creator’s current publication for later changes.


