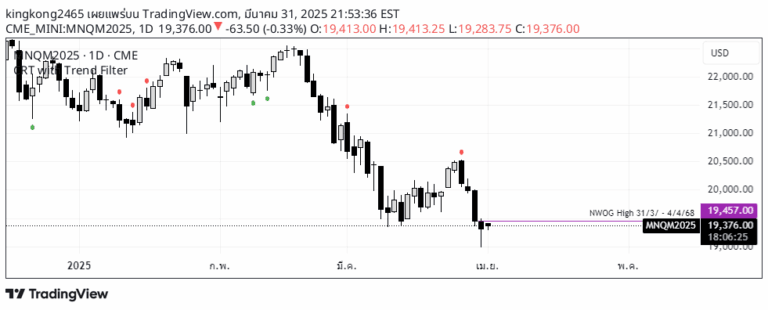
A trading indicator analyzing the Open, High, Low, and Close of the last 10 candles to provide insights into market price action and potential trading opportunities.
Explore complementary indicator rolesHow it works
The OHLC OG - 10 Candles indicator systematically tracks and visualizes the Open, High, Low, and Close prices of the most recent 10 candle periods. By collecting and displaying these critical price data points, the indicator creates a structured representation of recent market movements and price action dynamics.
Traders can observe how these levels interact with current price, identifying potential trends, support and resistance zones, and market sentiment. The indicator processes each candle's OHLC data to help traders understand the underlying market structure and potential future price movements.
Why it may be useful
Price action analysis is crucial for understanding market dynamics and making informed trading decisions. By providing a clear visualization of recent price movements, this indicator helps traders identify key market trends and potential trading opportunities with greater precision.
The comprehensive view of the last 10 candles enables traders to detect subtle shifts in market sentiment, recognize emerging patterns, and develop more strategic entry and exit points. This systematic approach reduces emotional decision-making and provides a structured method for interpreting market behavior.
When to explore it
The OHLC OG - 10 Candles indicator is most effective during periods of consistent market movement and when clear price action patterns are emerging. It works exceptionally well in markets with defined trends, helping traders confirm existing market directions and potential trend reversals.
Traders should utilize this indicator across various timeframes and asset classes, particularly when seeking to understand short-term market dynamics. It is especially valuable during volatile market conditions, providing a structured approach to interpreting complex price movements and supporting more informed trading decisions.
Keep exploring
What we’ve verified
Access, alerts and repainting behaviour have not been independently verified for this indicator. Check the creator’s current publication and settings.
General descriptions and classifications are recovered research. Verified details above identify the specific checks we have completed. Check the creator’s current publication for later changes.