
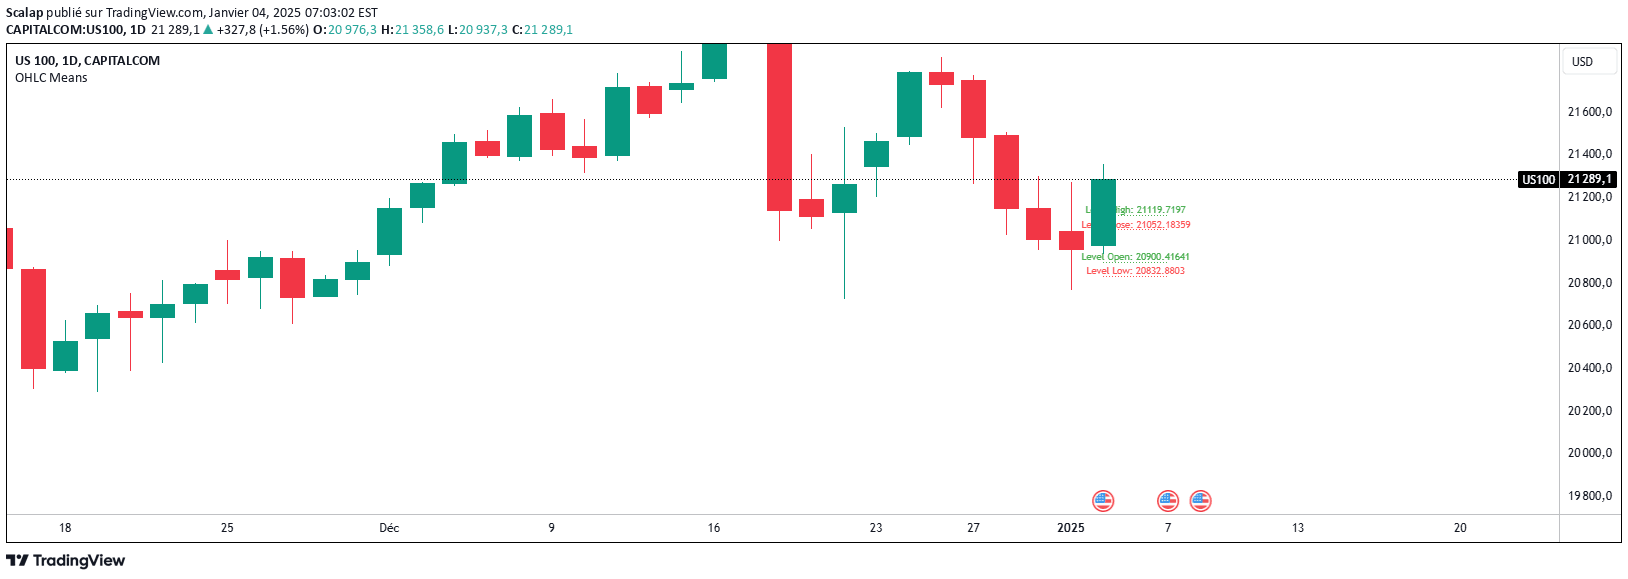
A daily timeframe indicator that calculates OHLC averages for specific days, providing historical price level insights by analyzing the last 1000 candlesticks.
Explore complementary indicator rolesHow it works
The indicator operates exclusively on daily timeframes by analyzing historical price data for specific days of the week. It calculates Open, High, Low, and Close (OHLC) averages by examining the last 1000 candlesticks, which typically represents approximately 200 trading days or roughly seven years of historical data.
For each specific day of the week, the indicator computes average price levels, creating visual reference lines on the chart. These lines represent the historical Open, High, Low, and Close averages, with color coding to indicate bullish (green) or bearish (red) market movements.
Why it may be useful
This indicator provides traders with a unique perspective on historical price behavior by revealing consistent patterns and average price levels for specific days of the week. By understanding these long-term averages, traders can identify potential support and resistance levels, gaining insights into market dynamics and potential future price movements.
The visual representation of historical price averages helps traders make more informed decisions by offering a broader context beyond immediate price action. It allows for a deeper understanding of market cycles, potential trend confirmations, and long-term trading strategies.
When to explore it
The indicator is most effective for assets with extensive historical datasets and when used on daily timeframes. It is particularly valuable for swing traders who seek to understand broader market trends and long-term price behavior across specific days of the week.
Traders should consider using this indicator when analyzing markets with consistent trading patterns, such as major stock indices, commodities, or forex pairs. It is less suitable for highly volatile or thinly traded markets where historical patterns may be less reliable.
Keep exploring
What we’ve verified
Access, alerts and repainting behaviour have not been independently verified for this indicator. Check the creator’s current publication and settings.
General descriptions and classifications are recovered research. Verified details above identify the specific checks we have completed. Check the creator’s current publication for later changes.


