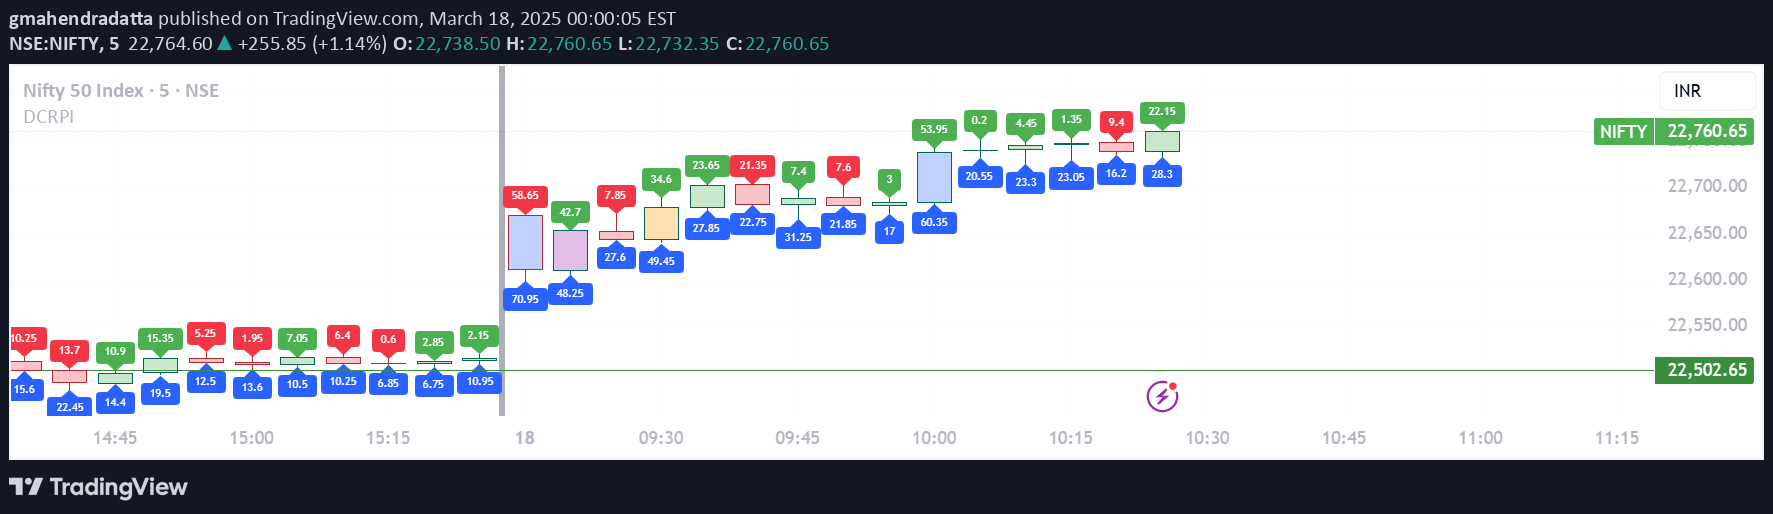
A specialized indicator that calculates the body percentage of a candlestick relative to its total length, helping traders assess price action and potential market sentiment.
Explore complementary indicator rolesHow it works
The candlestick body percentage indicator measures the relationship between a candle's open and close prices compared to its total range. It calculates the proportion of the candlestick's body against its entire vertical length, including wicks or shadows. By comparing the body size to the total candle length, traders can quickly understand the strength of price movement and potential market dynamics.
The calculation involves dividing the absolute difference between open and close prices by the total price range of the candlestick. A higher body percentage suggests stronger price movement in a specific direction, while a smaller body indicates more indecision or balance between buyers and sellers during that trading period.
Why it may be useful
Understanding candlestick body percentages provides traders with insights into market sentiment and potential trend strength. A large body percentage can indicate decisive price movement and strong momentum in a particular direction, signaling potential trend continuation or reversal. Traders can use this information to make more informed decisions about entry and exit points.
By analyzing body percentages across multiple timeframes, traders can develop a more nuanced understanding of market psychology. This indicator helps distinguish between periods of strong directional movement and times of market uncertainty, allowing for more strategic trading approaches.
When to explore it
The body percentage indicator works best in markets with clear directional movements and during periods of active trading. It is particularly useful in volatile markets where price action can quickly change, providing traders with rapid insights into market sentiment. Traders can apply this indicator across various financial instruments, including stocks, forex, and cryptocurrencies.
Optimal usage occurs when combining the body percentage analysis with other technical indicators to confirm signals and reduce false positives. It is most effective when used alongside trend indicators, momentum oscillators, and volume analysis to create a comprehensive trading strategy.
Keep exploring
What we’ve verified
Access, alerts and repainting behaviour have not been independently verified for this indicator. Check the creator’s current publication and settings.
General descriptions and classifications are recovered research. Verified details above identify the specific checks we have completed. Check the creator’s current publication for later changes.