
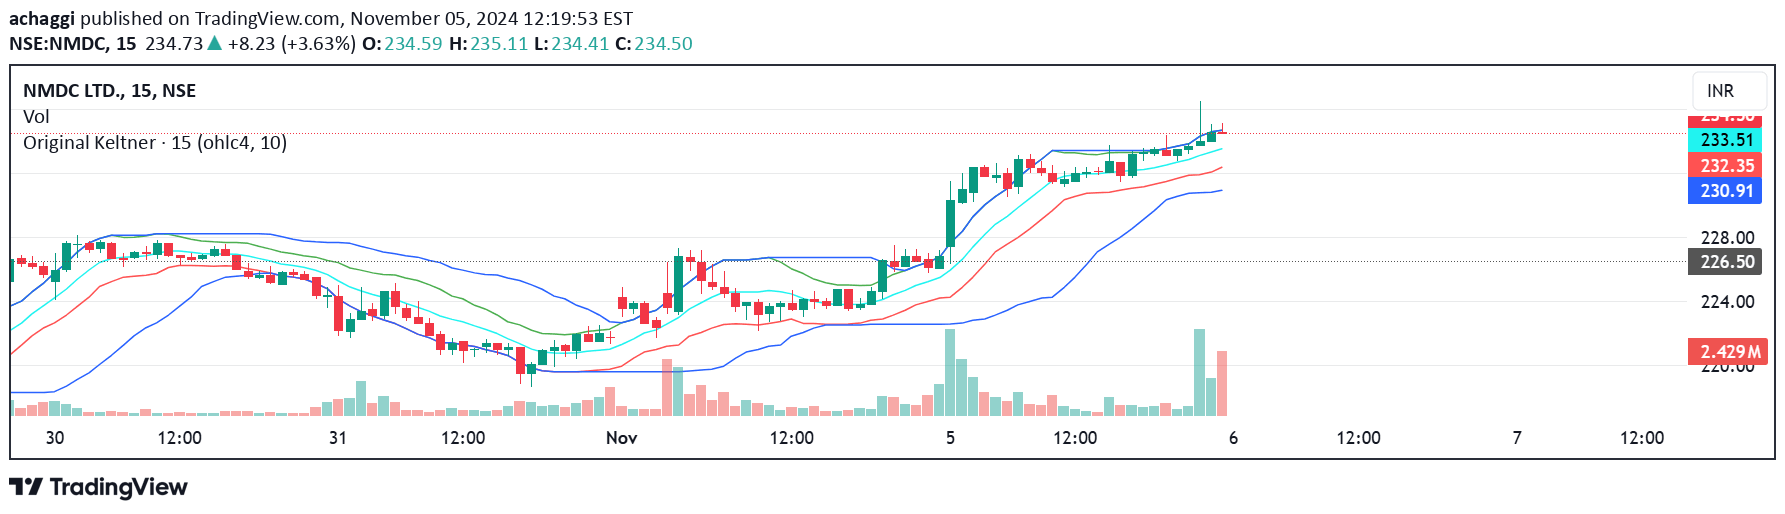
A channel-based trading indicator that uses typical price and price range to create dynamic support and resistance lines for trend identification and trade entry points.
Explore complementary indicator rolesHow it works
The indicator calculates a typical price using the average of open, high, low, and close prices over a 10-period window. It then determines buy and sell lines by adding and subtracting the average price range from the typical price average. This creates dynamic channels that adapt to recent market volatility.
The indicator also identifies the highest buy line and lowest sell line, which serve as potential support and resistance zones. These lines help traders understand market trends by indicating whether price is moving above or below the channel boundaries.
Why it may be useful
This indicator provides traders with a flexible and adaptive method for understanding market dynamics and potential trade opportunities. By using multiple price components and a moving average, it offers a more nuanced view of market trends compared to single-metric indicators.
The support and resistance lines help traders make more informed decisions about entry and exit points, reducing the risk of trading against the prevailing market trend. Its ability to dynamically adjust to changing market conditions makes it a versatile tool for technical analysis.
When to explore it
The indicator works best in markets with clear trending behavior and moderate volatility. It is particularly useful for traders seeking to identify trend direction and potential reversal points in short to medium-term timeframes.
Traders should be cautious when using this indicator in choppy or sideways markets, where price may frequently cross the channel lines without establishing a clear trend. Combining this indicator with other technical analysis tools can help confirm signals and improve trading strategy reliability.
Keep exploring
What we’ve verified
Access, alerts and repainting behaviour have not been independently verified for this indicator. Check the creator’s current publication and settings.
General descriptions and classifications are recovered research. Verified details above identify the specific checks we have completed. Check the creator’s current publication for later changes.


